


Many ESPHome devices look stable right after flashing. Sensors report values, Home Assistant discovers entities, and automations work. The harder failures show up later: the node reboots after several days, the API disconnects, a sensor value freezes, or the only fix seems to be power cycling the device.
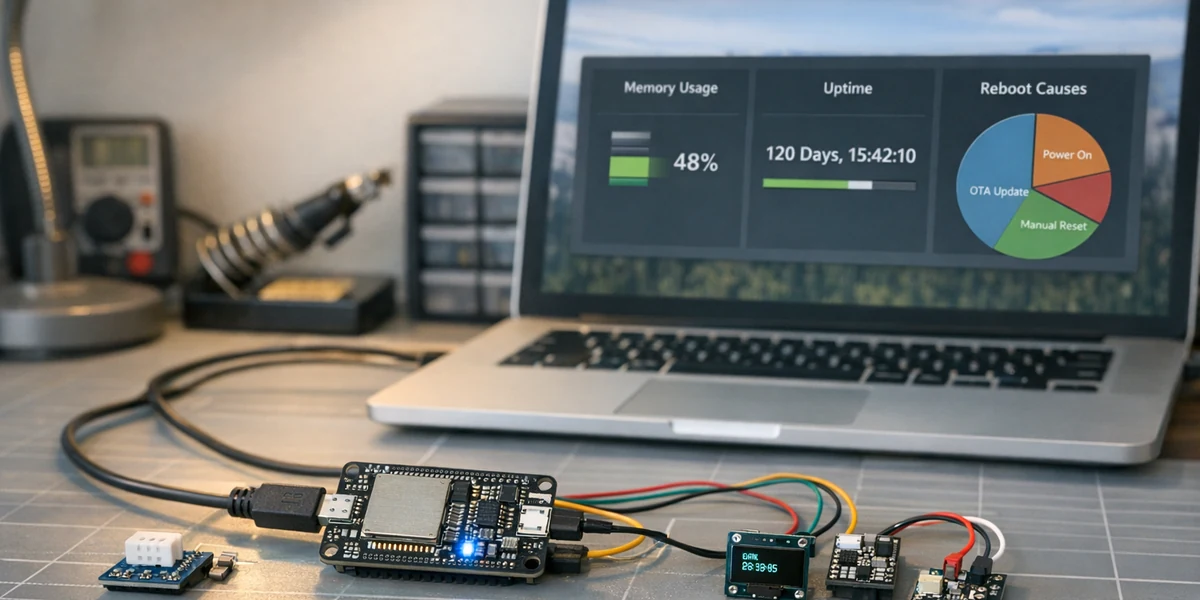
The core conclusion is straightforward: long-uptime ESPHome failures are rarely caused by one bad YAML line. They are usually accumulated system effects across memory behavior, blocking components, Wi-Fi conditions, logging, and sensor timing. If the device does not expose uptime, reset reason, free heap, minimum free heap, fragmentation, Wi-Fi signal, and last valid readings, it is difficult to tell a memory leak from heap fragmentation, a network issue, or a stalled peripheral.
Definition block
Long-uptime debugging means diagnosing devices that work at first but fail only after days or weeks. The target is not compile errors or a single wiring mistake. The target is reboot patterns, stale values, intermittent disconnections, and runtime health signals.
1. Why “it ran for one day” is not a stability test
ESP32 and ESPHome prototypes can be misleading. Once the device appears in Home Assistant and updates a few entities, it is tempting to treat the firmware as finished. Long runtime exposes problems that short bench tests miss.
Common long-uptime failure sources include:
| Symptom | Likely cause | Signals to observe |
|---|---|---|
| Reboot after days | heap pressure, fragmentation, watchdog, power dips | uptime, reset reason, free heap, min free heap |
| Device online but values freeze | blocked sensor, I2C fault, stuck component update | last valid reading, component logs, bus errors |
| Home Assistant API disconnects | weak RSSI, router roaming, API keepalive problems | Wi-Fi signal, reconnect count, disconnect time |
| Node becomes slower over time | excessive logs, dynamic allocation, web server or display load | loop time, fragmentation, log level |
| Failure recovers and returns | power supply, wiring, humidity, field interference | restart time, environment, power observations |
Decision sentence: if an ESPHome node exposes only business sensors and no runtime diagnostics, a failure after several weeks becomes guesswork instead of engineering analysis.
2. Add diagnostic entities before changing the design
The first response should not be rewriting the YAML. The first response should be making runtime health visible. A useful minimum set is:
- uptime, so every restart becomes visible.
- reset reason, so software restarts, watchdogs, brownouts, and power resets are not mixed together.
- free heap, to track current memory availability.
- minimum free heap, to catch low points that disappear after reboot.
- fragmentation or maximum block size, to expose fragmented heap behavior.
- Wi-Fi signal, to avoid treating radio problems as firmware crashes.
- last valid reading, to distinguish stale data from fresh data.
debug:
  update_interval: 60s
sensor:
  - platform: uptime
    name: "Node Uptime"
  - platform: debug
    free:
      name: "Heap Free"
    block:
      name: "Heap Max Block"
    loop_time:
      name: "Loop Time"
text_sensor:
  - platform: debug
    reset_reason:
      name: "Reset Reason"
This is not a full production template. It is the debugging boundary: business entities describe the environment, while diagnostic entities describe whether the node itself can still be trusted.
3. Use one diagnostic path to narrow the failure
flowchart TD

A("Device anomaly found"):::slate --> B("Did uptime reset?"):::blue
B -->|Yes| C("Check reset reason"):::cyan
B -->|No| D("Are business values stale?"):::orange
C --> E("Correlate heap, Wi-Fi, and power"):::violet
D --> F("Check blocked components and bus errors"):::green
E --> G("Build minimal reproduction"):::blue
F --> G
G --> H("Change one variable and observe 3-7 days"):::orange

classDef blue fill:#EAF4FF,stroke:#3B82F6,color:#16324F,stroke-width:2px;
classDef cyan fill:#E9FBF8,stroke:#14B8A6,color:#134E4A,stroke-width:2px;
classDef orange fill:#FFF3E8,stroke:#F08A24,color:#7C3F00,stroke-width:2px;
classDef violet fill:#F4EDFF,stroke:#8B5CF6,color:#4C1D95,stroke-width:2px;
classDef green fill:#ECFDF3,stroke:#22C55E,color:#14532D,stroke-width:2px;
classDef slate fill:#F8FAFC,stroke:#64748B,color:#1F2937,stroke-width:2px;
The first split matters: did the device really reboot, or did one part of the data path stall? Reboots push the investigation toward reset reason, heap, power, and watchdog behavior. Stale values without a reboot push it toward sensor drivers, I2C or UART behavior, blocking calls, and external services.
Do not change Wi-Fi, logging, sampling intervals, sensor configuration, and power at the same time. Long-uptime failures already take time to reproduce. Changing several variables at once makes the next result harder to interpret.
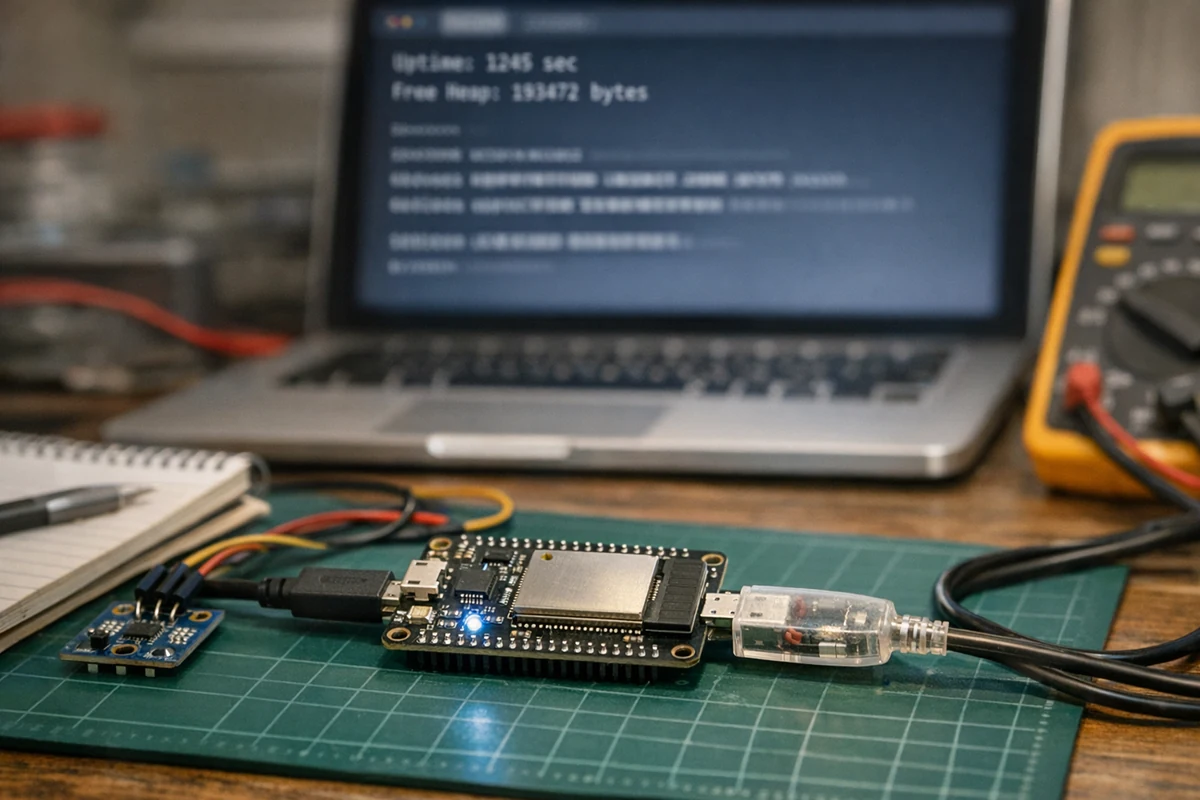
4. Heap debugging is about low points and fragmentation, not only current free memory
Many ESP32 nodes have enough free heap right after boot. After days of runtime, two different problems can appear:
- Total free heap gradually drops, which can indicate a leak or unbounded cache.
- Total free heap looks acceptable, but the largest contiguous block shrinks, so larger allocations fail.
That is why current free heap is not enough. A minimum-free signal can expose short low-memory events, while fragmentation or largest-block diagnostics can show that memory is available but not available in useful contiguous chunks.
Decision sentence: if an ESP32 node reboots only after reconnects, sensor faults, display refreshes, or bursts of logging, observe heap low points and largest block size before blaming the last visible component.
A practical narrowing sequence is:
- Reduce log verbosity so the device is not spending long periods formatting and transmitting logs.
- Temporarily remove nonessential components such as web server, display, Bluetooth scanning, or high-frequency template sensors.
- Increase sensor
update_intervalto see whether a specific sampling cadence triggers the failure. - Remove complex lambda code and string formatting to see whether the heap curve stabilizes.
- Run the same configuration on another board and power supply to separate firmware behavior from hardware variance.
5. Wi-Fi and API disconnects are not always firmware crashes
An ESPHome device showing offline in Home Assistant does not automatically mean the MCU crashed. Wi-Fi roaming, weak RSSI, router restarts, API connection behavior, mDNS resolution, and network congestion can all look like device failure from the dashboard.
Ask two questions first:
- Did uptime reset? If not, the firmware may still be running.
- Is there serial or local log output? If yes, the problem may be the network or API path.
For devices inside metal cabinets, distribution boxes, cold rooms, equipment rooms, or industrial spaces, radio quality is part of device stability. Do not repair a network problem as a firmware problem. Add Wi-Fi signal, connection state, and last publish time first; then decide whether to move the router, change the antenna, use Ethernet, or delegate the critical path to a more reliable gateway.
For teams using ESPHome devices in cold rooms, equipment rooms, or other commercial sites, stability issues often involve both device configuration and Home Assistant integration. ZedIoT provides ESPHome Home Assistant integration services to help connect sensors, relays, ESP32 nodes, and Modbus devices into reliable local dashboards, alerts, and automation.
6. When ESPHome is the wrong abstraction
ESPHome is excellent for configurable Home Assistant devices, small sensor gateways, and fast integration work. It becomes less suitable when the node turns into a production controller with complex runtime requirements.
Be cautious when the project needs:
- strict real-time control, complex state machines, or safety interlocks.
- local queues, protocol retries, persistent buffering, or multiple coordinated tasks.
- staged OTA, remote log collection, self-recovery, and fleet operations.
- code-level control over memory, tasks, stack behavior, and peripheral failures.
The practical boundary is this: use ESPHome for observable, configurable, low-friction edge nodes. When the device becomes a production gateway or controller, consider ESP-IDF, custom firmware, or moving the complex logic into an edge gateway or platform service.