

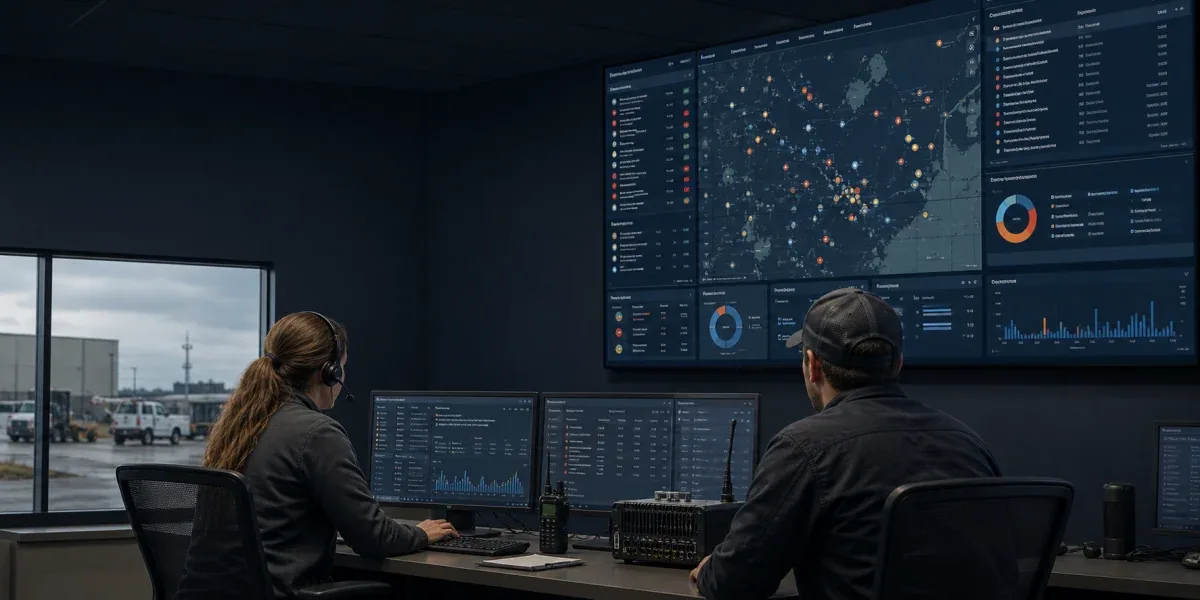
A practical Fleet Ops console should not begin by answering how many devices exist. It should let an on-call operator answer six questions within one minute: what happened, which devices are affected, how fresh the evidence is, what action ran last, what happened to that action, and which next step is safe. A page with device names, a green connection dot, and a Send Command button is an asset inventory, not an operations console.
Answering those questions requires device identity, presence, telemetry freshness, alarms, versions, command outcomes, and bulk jobs to be connected without collapsing them into an ambiguous health value. Online does not mean controllable. Recent telemetry does not prove that the provider reported the device online. A command accepted by the control plane does not prove that the device executed it.
This article uses the current device list, presence projection, route resolution, alarm query, command lifecycle, and panel-context code in Grus IoT Core as a first-hand sample. A focused local suite of 22 tests passed across pagination boundaries, controllability, alarms, and command behavior. That evidence verifies specific code paths; it is not a production scale test, a usability study, or a claim about customer outcomes.
1. Design around the operator's question sequence
Device pages are often shaped by database columns: device_id, product_key, created_at, and status. Those fields help developers, but they do not create an incident workflow. Operators start with an anomaly, narrow its blast radius, assess whether the evidence is trustworthy, and only then choose an action.
The first screen should follow this question ladder:

This sequence determines visual priority. Top-level metrics should emphasize actionable scope: newly opened critical alarms, devices that became stale during the last hour, failed or timed-out commands, version drift, stuck OTA jobs, and unowned incidents. Total device count can remain, but it is context rather than the operator's starting point.
Default ordering should also serve triage. A useful sequence is unacknowledged critical alarms, recent failed actions, expired state evidence, version or configuration drift, ordinary offline devices, and healthy devices last. Sorting only by updated_at allows high-frequency but low-risk telemetry to bury the incidents that require human attention.
2. Keep five read models separate from a generic status column
Fleet operations needs at least five related but semantically independent read models. They may appear on the same row, but they should not share one status field.
| Read model | Minimum facts | Common false inference | Correct interaction |
|---|---|---|---|
| Identity and scope | Name, stable ID, product, site, group, service owner | Same-name devices or cross-site confusion | Preserve tenant, site, and device scope in every link |
| Presence and freshness | Display state, source, observed time, age, confidence | Old connection state treated as real-time truth | Show online, offline, stale, or unknown with evidence |
| Health and alarms | Open alarms, severity, first/last time, owner, SLA | One score hides the root cause | Use scores for ordering but expose reason codes |
| Action and controllability | Last command, state, trace, route, template, timeout, outcome | Accepted means executed | Display the command state machine and terminal evidence |
| Versions and change | Firmware, configuration, model, desired version, cohort, rollback point | Latest version label means successful rollout | Compare current, desired, drift, and rollout state |
Presence is the most frequently misrepresented layer. Microsoft's Azure IoT Hub documentation warns that its connectionState can be delayed and should not be the only production runtime signal used before an action. That aligns with the layered model in the local implementation: provider presence, runtime activity, freshness, and availability remain distinct. Missing new evidence is not affirmative proof of offline, while recent traffic still does not prove a command route exists.
A health score can help prioritize a list, but it must remain an entry point. The current Grus health projection combines presence, telemetry freshness, open alarms, failed commands, and OTA state into explicit components and reasons, while retaining last_event_time and freshness_source. That is more actionable than returning 72 because the operator can distinguish a disconnected device from a reachable device with a failed command.
Version views need the same honesty. Showing firmware: 1.7.3 is insufficient without desired version, reported version, evidence time, release ring, update job, and rollback point. Otherwise, an old-version device may simply have stopped reporting, and an “updated” device may only have received a job request.
3. Separate online from controllable
The most dangerous shortcut in remote operations is wiring a green online indicator directly to Send Command. Controllability also depends on effective command candidates, an enabled template, an available protocol or provider route, and authorization for the current subject and device. If any condition is missing, the interface should state why before a user clicks.
The focused tests cover several counterintuitive paths. Provider display-online does not imply control. Fresh authoritative provider presence still needs an effective command candidate and route. Expired presence cannot enable control. Runtime activity without a route remains non-controllable. Repeated devices with the same route decision reuse that result rather than scanning connectors per row. All 22 selected tests passed.
The command area should show a state progression rather than a Boolean result: created, queued, dispatched, acknowledged, succeeded, failed, timeout, or cancelled. Exact names vary, but the interface must distinguish control-plane acceptance, protocol dispatch, provider or device acknowledgement, and terminal business outcome. Idempotency key, target version, timeout, attempt count, and trace ID are necessary to explain duplicate clicks, retries, and late acknowledgements.
When control is uncertain, offer a diagnostic path: inspect recent telemetry, refresh presence, check the connector route, verify the model projection, and open the command timeline. A disabled button with no reason pushes operators toward database queries and chat channels, removing the console from the audit trail.
4. Walk one incident end to end instead of reviewing menus
At 09:10, imagine 17 temperature and humidity terminals in one warehouse zone raise disconnect alarms. The first screen should group the affected scope instead of presenting 17 unrelated red dots. Drilling down shows that all devices share one gateway. Twelve stopped reporting telemetry at 09:08, while five still have recent activity but provider presence is unknown.
The correct conclusion is not that all 17 devices are offline. A gateway or state-source failure is a stronger hypothesis. The console should compare gateway state, device activity, alarm start time, and recent deployments. If a gateway configuration changed at 09:05, that last action belongs on the same timeline rather than in a separate audit product.
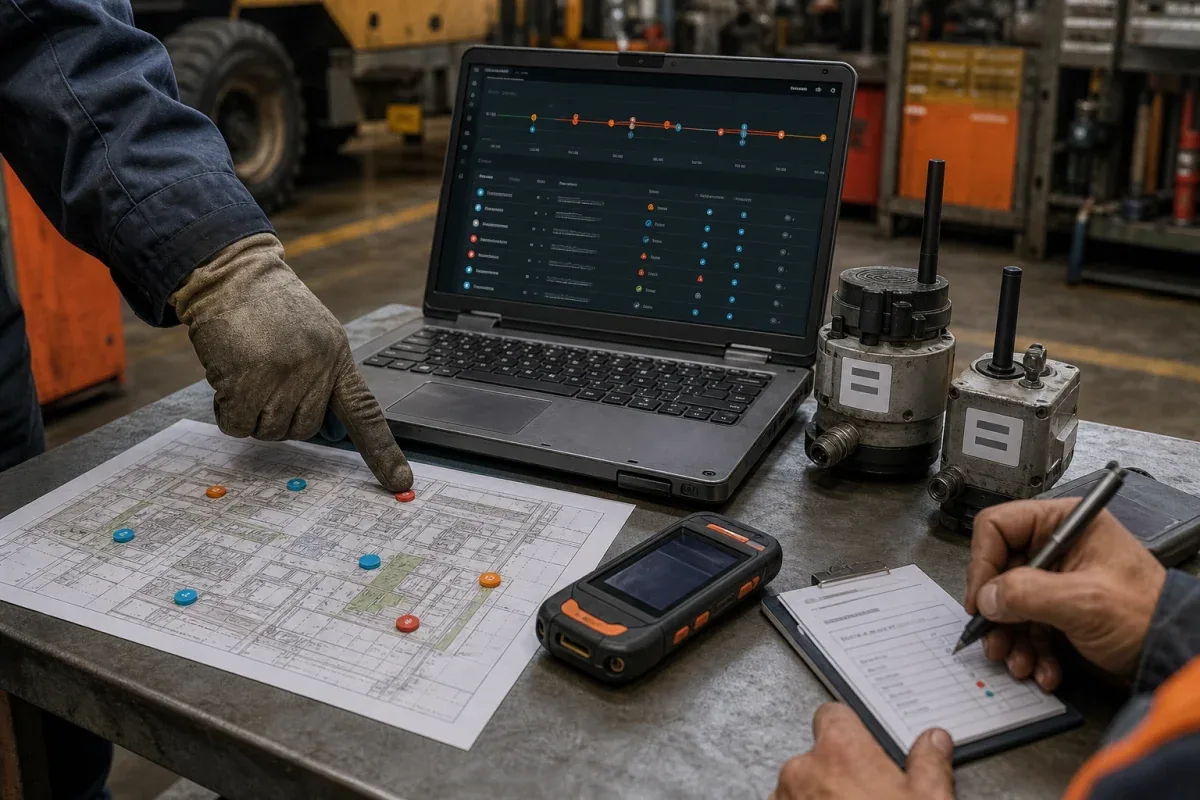
An operator selects one still-active device for a low-risk diagnostic. Before dispatch, the console validates the command template, route, and permission, then shows create, dispatch, acknowledgement, and outcome. If it succeeds, the next investigation may target presence aggregation or alarm logic rather than rebooting 17 devices. If it times out, retain timeout, route, trace, and attempt evidence instead of displaying “Operation failed. Try again.”
Only then should bulk action begin. The selection view must show site, product, version, and controllability distributions and freeze a target snapshot before confirmation. Devices that are unauthorized, incompatible, or not controllable require an explicit fail-all or partial-success policy. The result must preserve per-device outcomes and a retryable subset, not merely “82% success.”
This walkthrough exposes integration failures that menu-by-menu acceptance misses: whether lists, alarms, commands, versions, and audit share the same device identity; whether time uses consistent semantics; whether users can return to the original affected scope after drilling down; and whether a changing filter can expand a bulk job after approval.
5. Use a measurable Fleet Ops acceptance scorecard
“The dashboard looks complete” is not an acceptance criterion. Test operators with incident scripts and measure whether the interface produces decisions.
| Dimension | Pass condition | Failure signal |
|---|---|---|
| Triage time | Identify incident, scope, and evidence time within 60 seconds | Export CSV or visit several unrelated pages first |
| State honesty | Every state has source, observed time, or unknown | Red/green dots without freshness or confidence |
| Command closure | Trace creation, route, ACK, terminal state, and trace ID | Only a “Sent” toast |
| Alarm ownership | Owner, workflow state, SLA, and handling timeline exist | Closing removes the incident history |
| Bulk safety | Freeze targets, preflight permission/compatibility, return per-device results | Dispatch directly from a live filter |
| Scale boundary | Pagination, search, and aggregation have limits and degradation behavior | Load the entire fleet into the browser |
The local fleet-listing tests verify that one page returns only its bounded result, pages neither overlap nor skip, page size is capped, total describes the result set, and gateway lookup avoids a whole-tenant scan. Alarm-query tests verify that device context loads once per unique device and only the requested page is serialized. These tests support a bounded-read-model decision, but they do not provide a million-device benchmark.
Capacity should therefore be explicit. A small profile might assume 1,000 devices and target sub-500 ms P95 list queries. A medium profile might assume 100,000 devices with server-side indexes and aggregates. A large profile should split fleet search, alarm aggregation, command jobs, and telemetry history into separate read models with defined index delay and degradation. These are planning profiles, not measured results from this article.
6. Migrate from device CRUD to an operations workbench
Phase one does not require a full front-end rewrite. Standardize device identity and scope keys, then add state source, observed time, open alarms, last command, and version drift to the existing list. Every indicator should drill into evidence. Acceptance means the same device retains consistent identity and time semantics across list, detail, alarm, and command views.
Phase two establishes bounded read models. Presence, health, alarms, commands, and versions may have different stores and refresh intervals, but they expose consistent tenant, site, and device scope. Replace full-fleet browser filtering with server-side pagination and indexes. When a read model is unavailable, show a degraded state and last successful refresh instead of silently serving an old snapshot.
Phase three closes the action loop. Make controllability an explicit projection of template, route, authorization, presence, and target state. Record idempotency, retry, acknowledgement, timeout, and cancellation on a command timeline. Freeze bulk targets and keep per-device outcomes. Start with low-risk diagnostic commands before enabling configuration, reboot, or OTA actions.
Phase four validates incidents rather than page counts. Each month, test gateway failure, stale state source, version drift, partial bulk-command failure, and alarm storm scenarios. Measure triage time, false inference, page transitions, and manual database queries. If the metrics do not improve, adding another chart is unlikely to help; revisit state semantics and evidence linkage.
For a single-site deployment with dozens of devices and no remote control, the full workbench may be excessive. Clear identity, evidence time, alarms, and audit can be enough. Once a platform supports multiple sites, customer support, or remote commands, however, a CRUD table plus online dots becomes an incident amplifier.
7. Conclusion
The unit of a Fleet Ops console is not a device record. It is an explainable operational decision connecting incident, affected scope, evidence freshness, last action, controllability, and safe next step while allowing uncertainty to remain unknown.
To assess an existing platform, select one failed command and ask an operator to explain within a minute who was affected, whether the device was truly online, which route the command used, which terminal evidence arrived, and whether only the failed subset can be retried. If the answer still depends on database access, chat history, and individual memory, the next investment should be read models and action closure—not another wallboard.
FAQ
How is a Fleet Ops console different from a device management admin page?
An admin page emphasizes registration, editing, and configuration. Fleet Ops emphasizes anomaly discovery, scope assessment, safe action, and outcome verification. They may share data but require different ordering, state semantics, and audit depth.
Should the console keep a device health score?
Yes, for ranking and aggregation, provided it exposes components, reasons, and evidence time. A score without explainable reason codes hides different failure paths.
Why not enable remote control whenever a device is online?
Online represents one class of state evidence. Control also requires an effective command candidate, protocol or provider route, authorization, version compatibility, and a result loop. Missing any one should disable or degrade control.
References
- Microsoft Azure IoT Hub: Device management lifecycle and patterns
- Microsoft Azure IoT Hub: Monitor device connection status
- Microsoft Azure IoT Hub: Device configuration best practices
- Microsoft Azure IoT Hub: Monitoring data reference
- Industrial IoT Alarm Event Modeling
- Firmware, Configuration, and Model Version Governance
- Permission Models for Multi-Tenant Device Management