

The hardest failures in low-power IoT are often not total silence. They show up as partial signals: battery voltage drifting down, RSSI getting worse, reports arriving later than expected, occasional reconnects, or one firmware version producing more resets than the rest of the fleet. If the platform copies server monitoring and asks every device to stream detailed logs, minute-level metrics, and full event traces, the diagnostic layer can become the thing that drains batteries and overloads narrow links.
The core conclusion is: remote diagnostics for low-power devices is not about sending every log line to the cloud. It is about deciding what problem is worth waking the device for, then combining minimal metrics, tiered logs, field context, and bounded diagnostic windows into enough evidence for action. When battery, cellular cost, weak coverage, and sleep intervals matter, diagnostics must be designed as part of the power and operations model.
If you already have a device management platform, this article builds on two related patterns: the core architecture of an IoT device management platform and device online state modeling. Here we focus on what happens after something looks wrong: how the platform gathers enough evidence without forcing a constrained device to behave like a server.
1. Remote diagnostics is a tradeoff first
1.1 Why server monitoring patterns fail
Server monitoring assumes three things: the node is usually online, power is stable, and bandwidth is cheap enough for frequent telemetry. Low-power IoT devices often violate all three assumptions.
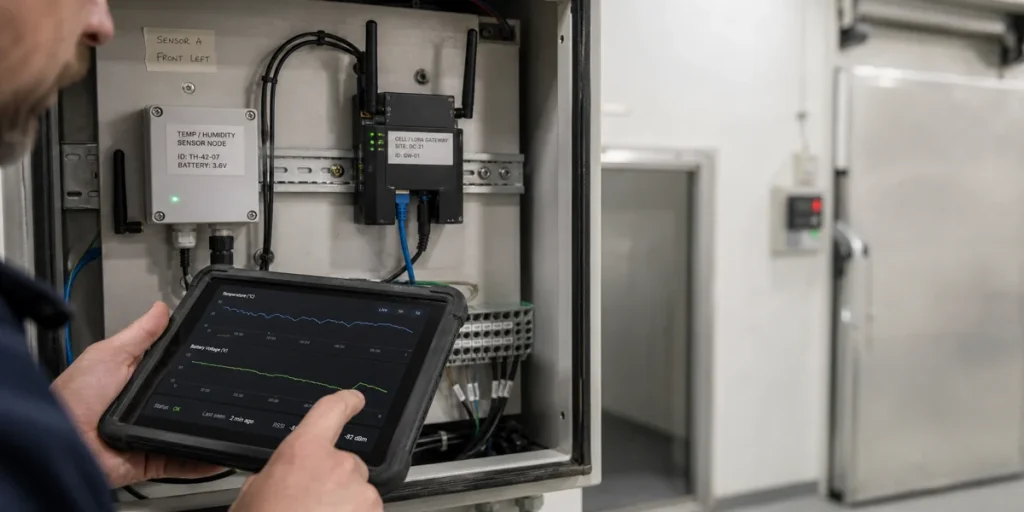
A battery-powered sensor may wake every 15 minutes. An NB-IoT or LTE-M device may close its connection aggressively to save energy. A cold-chain, utility, or agriculture deployment may sit behind weak coverage. If the platform still demands realtime logs, high-frequency metrics, and always-on diagnostic channels, the result is not better troubleshooting. It is more wakeups, more retries, more airtime, and shorter device life.
A safer judgment is: diagnostic data from constrained devices should be collected by value, not by curiosity. Fields that explain battery, signal, firmware, configuration, sensor health, and upload path deserve priority. Verbose debug traces should be collected only inside a bounded diagnostic window.
1.2 The platform is answering several questions
When a constrained device fails, operations needs to answer more than one question:
- is this battery, signal, firmware, configuration, or sensor path
- is it one device, one batch, one region, or one firmware version
- can the device still be reached during its next wake window
- should the team adjust configuration, trigger a restart, roll back firmware, or send a technician
If the platform only stores last_seen_at and an offline flag, none of those questions can be answered well. The diagnostic model needs enough reason fields to guide the next action rather than pushing every case back to field staff.
2. The minimum useful diagnostic signal set
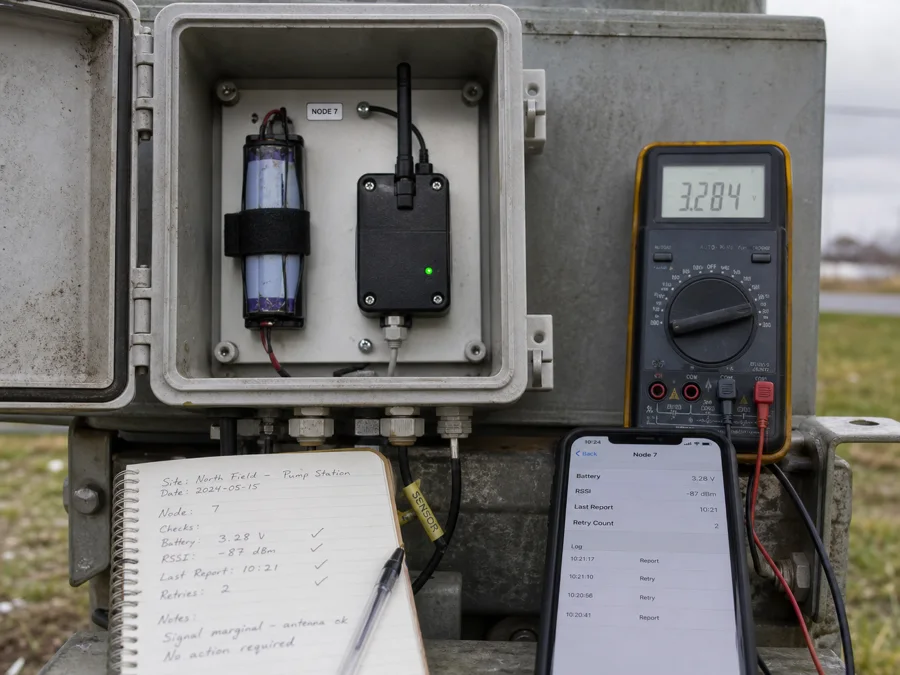
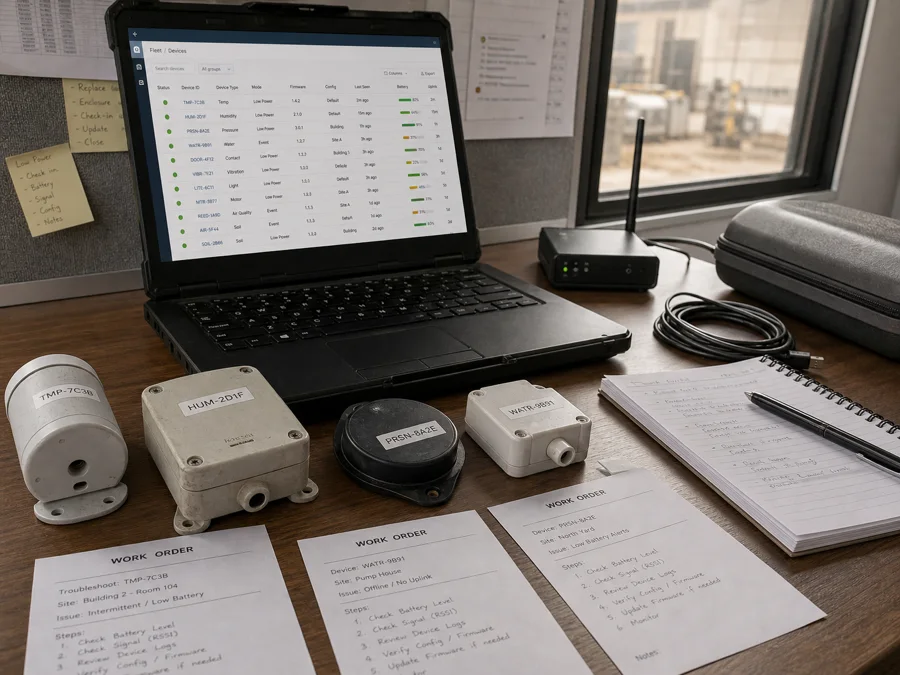
Low-power devices should not stream full logs continuously, but they do need to report a compact signal set. A practical baseline has five groups.
| Signal group | Key fields | What it explains | Suggested cadence |
|---|---|---|---|
| Power state | battery_voltage, battery_percent, power_mode | battery decline or power instability | with heartbeat or business report |
| Radio quality | RSSI, RSRP, SNR, retry_count | weak coverage or retry pressure | on connect or failure events |
| Runtime context | firmware_version, config_version, boot_id, reset_reason | version, configuration, or reboot correlation | on startup and after abnormal events |
| Data freshness | last_sample_at, last_upload_at, queue_depth | sampling failure versus upload failure | low-frequency summary |
| Error summary | error_code, error_counter, last_error_at | whether failures cluster by type | event-triggered or inside a window |
These fields do not need to be uploaded every second. Their value is that they make the fleet searchable by device type, batch, location, and version. If one region shows weaker RSSI and more retries, start with coverage. If one firmware version shows watchdog resets, start with firmware tasks, memory, or timing.
3. Logs should be tiered, not continuous
3.1 Normal mode should send summaries
In normal mode, a constrained device should send summaries rather than full logs. Useful summaries include:
- last reset reason
- counters for the most recent error categories
- last upload failure reason
- current queue depth
- latest diagnostic window ID
This data is small, aggregatable, and useful for operations search. It does not try to reproduce every log line. It first tells the platform where the problem likely sits.
3.2 Exceptions should open short diagnostic windows
Detailed collection should start only when a condition is met. Common triggers include:
- repeated upload failures
- battery voltage crossing a threshold
- RSSI or RSRP staying below a threshold
- watchdog resets exceeding a limit
- a platform command that opens diagnostics until a specific expiry time
Every diagnostic window needs boundaries: duration, maximum log count, module scope, and a clear return to low-power mode. Without those boundaries, troubleshooting becomes a new battery drain.
3.3 Verbose logs need a decision purpose
The dangerous log is not no log. It is a large log that cannot change the next action. Loop traces, every sampling attempt, every retry stack, and repeated debug strings can consume power and bandwidth without answering whether the team should replace a battery, move an antenna, roll back configuration, or dispatch a technician.
If a field cannot support a decision, it should not be part of the normal diagnostic payload.
4. Field context must be structured
Many low-power failures are tied to physical deployment: antenna position, enclosure material, battery batch, mounting height, shielding, humidity, power source, or the latest service action. Some of that context does not come from the device, but it must still be part of diagnostics.
Useful field context includes:
site_idinstall_locationenclosure_typepower_sourcebattery_batchantenna_typelast_service_actionservice_note
This data may live in the operations console, work order system, or installation record. The important point is that it is bound to the device. Otherwise the platform may see 20 unstable devices in one area without noticing that all of them are mounted behind the same metal cabinet or use the same battery batch.
flowchart LR

A("Device Summary"):::blue --> D("Diagnostic Context")
B("Link Quality"):::cyan --> D
C("Field Installation Data"):::orange --> D
E("Firmware / Config Version"):::violet --> D
D --> F("Remote Judgment"):::slate
F --> G("Keep Watching"):::green
F --> H("Open Diagnostic Window"):::orange
F --> I("Rollback Config / OTA"):::violet
F --> J("Dispatch Field Service"):::blue

classDef blue fill:#EAF4FF,stroke:#3B82F6,color:#16324F,stroke-width:2px;
classDef cyan fill:#E9FBF8,stroke:#14B8A6,color:#134E4A,stroke-width:2px;
classDef orange fill:#FFF3E8,stroke:#F08A24,color:#7C3F00,stroke-width:2px;
classDef violet fill:#F4EDFF,stroke:#8B5CF6,color:#4C1D95,stroke-width:2px;
classDef green fill:#ECFDF3,stroke:#22C55E,color:#14532D,stroke-width:2px;
classDef slate fill:#F8FAFC,stroke:#64748B,color:#1F2937,stroke-width:2px;
The point of this flow is not to collect more fields for their own sake. It is to put device summaries, link quality, field context, and version data into one diagnostic context so the platform can choose different actions.
5. Downlink diagnostics need control
Low-power devices should not be treated as always-available RPC targets. Diagnostic commands need four properties:
- An expiry time, so the command disappears if the device misses its wake window.
- A power budget level, such as lightweight status query, short log window, restart, or rollback.
- An idempotency ID, so weak-link retries do not execute the same action twice.
- An execution receipt that reports received, executed, failed reason, and next reporting time.
If diagnostic commands are modeled as normal realtime commands, operations cannot tell whether the device never received the command, rejected it, executed it without a receipt, or missed the wake window. Treat diagnostics as bounded jobs, not instant RPC.
6. What the operations console should show
The final consumer of diagnostics is usually an operations or support team. A practical console should show:
- latest valid activity
- latest heartbeat summary
- battery and signal trend
- firmware and configuration version
- recent error summary
- pending diagnostic jobs
- recommended next action
The recommendation needs a reason. For example:
keep watching: reporting cadence is normal, battery and signal are stableopen diagnostic window: repeated upload failures but the device still responds during wake windowsrollback configuration: errors cluster around one configuration versiondispatch field service: low battery, weak signal, and repeated diagnostic job timeout
This is more useful than a red/yellow/green badge because it connects diagnostic evidence to an action.
7. When this is too much
Not every product needs a full diagnostic system. You can keep it simpler when:
- the fleet is small and field service is cheap
- devices are mains-powered and connectivity is stable
- the business only needs recent reporting, not remote repair
- the device is cheap enough that replacement is the intended support model
But once the fleet grows or field visits become expensive, richer diagnostics are usually worth the design cost. Medical cold chain, agriculture, industrial sensing, outdoor metering, and distributed gateways all make mistakes expensive: a wrong diagnosis can mean a wasted truck roll, spoiled inventory, downtime, or missing data.
8. Implementation checklist
If you are designing diagnostics from scratch, start in this order:
- Define wake cadence, reporting cadence, and diagnostic budget per device class.
- Collect only power, signal, version, queue, and error summaries in normal mode.
- Use short diagnostic windows for exception cases instead of always-on debug.
- Bind installation context and work-order history to the device record.
- Give downlink diagnostic commands expiry, power level, and idempotency.
- Show reasons and next actions in the operations console, not just online/offline state.
- Write each diagnostic action back into device history for later review.
The final judgment is: remote diagnostics for low-power IoT is not about collecting more data. It is about preserving enough evidence for a decision while minimizing wakeups, bytes, and unnecessary field work. When logs, metrics, field context, and diagnostic commands are part of one controlled model, operations can move from guessing why a device disappeared to choosing the next action from evidence.