

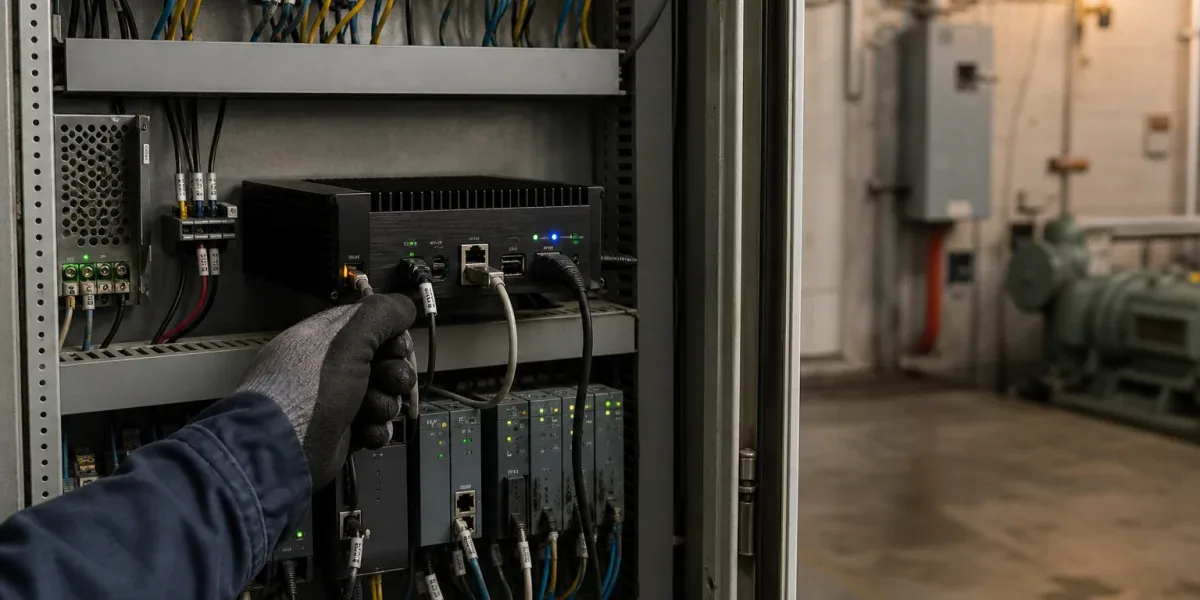
The first version of an industrial data platform often looks like one straight line: a PLC or sensor sends values to a gateway, the gateway publishes over MQTT, a backend consumer writes to a time-series database, and a dashboard queries the result. That line is adequate for a demonstration when the device count is small, the network is stable, and the schema never changes. Weak-network retries, duplicate events, device-clock drift, field upgrades, database maintenance, and historical replay expose its hidden assumption: a delivered message is not necessarily a trusted fact owned by the platform.
The central design rule is simple: divide the industrial telemetry pipeline by verifiable responsibility contracts, not by product names. The field layer produces observations with provenance. The edge layer preserves raw evidence and performs controlled normalization. The admission layer owns identity, schema, idempotency, and an explicit acceptance result. Durable messaging absorbs rate differences and bounded outages. Storage separates immutable history from rebuildable projections. Applications consume results that include freshness, quality, and lineage. Combining protocol parsing, business validation, historical storage, and alarm state in one layer may save a component initially, but it also lets one failure stop the entire path.
This article describes a deployable structure rather than prescribing a broker or database. Its first-hand evidence comes from existing ZedIoT platform architecture and focused ZedIoT Core regression tests for ingest deduplication, quarantine, telemetry-state semantics, and Timescale schema bootstrap. We ran 29 tests for those invariants. They do not prove a universal throughput, latency, capacity, or availability number; queue capacity, retention, chunk size, and SLOs must still be measured in the target environment.
1. Define Six Success Results Before Choosing Components
The most dangerous shortcut is to call MQTT QoS 1, a successful broker write, or a completed SQL INSERT “end-to-end success.” MQTT 5.0 defines delivery behavior between a sender and receiver, while Session Expiry governs how long session state can survive a disconnect. Neither mechanism verifies device authorization, units, schema compatibility, event time, state projection, or alarm visibility. A transport acknowledgement proves the transport contract and nothing beyond it.
An operable pipeline needs at least six independently observable outcomes: the field observation was formed; the edge normalized it and placed it in durable local storage; the platform passed identity and schema admission; immutable history was persisted; the latest-state or aggregate projection was refreshed; and the application saw the result within its freshness budget. Compressing those outcomes into success=true makes it impossible to tell whether data was never sampled, never transmitted, quarantined, backlogged, persisted but not projected, or projected but unavailable to the application.

The diagram does not require one deployed service per node. A small private deployment may run edge admission and its local event stream on one industrial PC, or keep history and state projections in one PostgreSQL cluster. The states and failure meanings must remain separate even when processes are combined. Interfaces, tables, metrics, and recovery actions should still distinguish the six results; otherwise a later scale-out merely spreads the original coupling across more containers.
2. Field and Edge Layers Should Preserve What Happened
A Modbus register, an OPC UA node, a vendor data point, and an analog acquisition channel are not inherently equivalent. A register value of 215 might mean 21.5°C or one segment of an accumulated energy value with four decimal places. If the gateway uploads only a normalized float and discards the original address, scale, device timestamp, and mapping version, the platform cannot explain the value or replay history after correcting a mapping.
The edge should create a traceable normalized event. A useful contract includes event_id, tenant_id, device identity, event_time, ingested_at, schema_version, a raw observation or digest, normalized fields, units, quality, and trace_id. Successfully mapped measurements enter standard metric fields. Unmapped or uncertain observations can remain diagnostic evidence, but they must not silently overwrite the latest trusted application state.
Our state-semantics tests exercise this separation. Mapped temperature is a primary state while the source data point remains diagnostic. Sparse messages retain an independent observed_at for each field, so a new temperature reading does not make a door state observed twenty minutes earlier appear fresh. A measurement marked uncertain may be retained in history without advancing the latest state. The extra lineage fields cost storage, but they prevent a much more expensive ambiguity: applications can distinguish “the value did not change” from “the value has not been observed recently.”
The edge also needs a bounded durable spool. An in-memory queue loses an outage window when the industrial PC restarts. An unbounded disk queue lets a cloud outage fill the edge disk until protocol acquisition fails. Size the spool from measured event rate, tolerated upstream interruption, and per-event disk cost. When that budget is exhausted, the system must deliberately downsample, discard low-priority metrics, reject new data, or request operator intervention. Infinite buffering is not a reliability strategy.
For a more detailed treatment of outage recovery, see Why Industrial Edge Gateways Need Store-and-Forward. Store-and-forward protects the edge-to-platform transfer window; it does not prove schema admission, historical persistence, or state projection.
3. Treat Duplicates, Collisions, Reordering, and Quarantine as Normal Inputs
Industrial networks operate in an at-least-once reality. A device, gateway, broker, or consumer may retry when it cannot determine whether the previous attempt succeeded. The realistic objective is not “duplicates never happen,” but “a duplicate never creates a second business fact.” An event_id should be stable within the tenant or device scope, and admission should retain a content digest. The same ID with the same content can return the previous result. The same ID with different content is a collision and must not advance history, offsets, checkpoints, or current state.
Our ingest regression tests distinguish reserved, processing, completed, and stale recovery. Initial admission acquires a claim token; a duplicate cannot write concurrently while processing is active; another request can recover a reservation only after the processing lease becomes stale; and a completed duplicate returns the stored result. Tests also verify that conflicting content under the same source_event_id returns a collision and leaves both history count and sequence checkpoint unchanged. This state machine is more involved than a single SETNX with TTL, but it differentiates duplicates, active work, and recoverable abandoned work.
Identity, signature, schema, time-window, sequence, or quality failure should not become one generic invalid payload followed by deletion. Repairable events belong in a quarantine stream with at least a reason_code, tenant, source, trace, schema version, content digest, and repair status. Quarantine must itself be idempotent, and durable persistence must happen before an in-process cache is updated. Otherwise, a failed first database write may poison the cache, causing the retry to be misclassified as already processed and permanently losing the evidence.
A durable event stream decouples admission speed from downstream processing speed, but it is not infinite storage. Choose partition keys from the required ordering domain, commonly tenant plus device or a device stream. Partitioning arbitrarily by metric can reorder state events from one device; putting an entire tenant into a single partition can let one hot device delay all others. Write down the required ordering scope before selecting Kafka, NATS, or broker rules.
OpenTelemetry Collector internal metrics offer a reusable operational pattern: observe queue size, capacity, enqueue failures, receiver refusal, and exporter send failures together. The same distinction should exist in industrial telemetry. Operators need to know whether an event was rejected before enqueue, is waiting durably, is retrying after send failure, or was accepted downstream. When a queue is full, an enqueue failure may never reach exporter retry logic, so monitoring retries alone misses the most important loss point.
4. History, Latest State, and Alarms Are Three Consumers
Defining current state as “the newest row in the history table” fails with sparse reports, late data, uncertain quality, and device-clock drift. Immutable history records that an observation occurred. Latest state applies event time, ingest time, quality, mapping version, and field-level freshness to calculate the best currently usable fact. Alarm processing uses stateful rules to open, suppress, escalate, and close incidents. All three may consume the same event, but they do not share one success condition.
Suppose a device reports temperature every twenty minutes but door status every two hours. A new temperature event appends to history and updates only the temperature projection; the door field retains its prior observation time. An alarm can evaluate fresh temperature without pretending the door reading is equally fresh. If yesterday's temperature arrives late, history may retain it and an aggregate job may recompute the affected window, while latest state rejects it as a backward update.
This separation also explains why an asset model should not hold all telemetry. The asset model owns device identity, product type, tenancy, and stable relationships. Operational state is a rebuildable projection. Telemetry is high-cardinality, time-growing history. Combining them into one “device table” couples write volume, indexes, access control, retention, and query behavior. Device Shadow vs. Digital Twin vs. Asset Model covers those ownership boundaries in more detail.
Application queries must be bounded as well. A device detail page reads a recent device window; an operations dashboard reads pre-aggregated results; offline analysis reads cold storage or an export. They should not all scan raw time-series history. Each API should constrain tenant, device, time range, metric set, pagination, or maximum points. A “return all history” endpoint without a time range turns one frontend mistake into a database incident.
5. Design Time-Series Storage Around the Data Lifecycle
Before choosing a time-series engine, quantify event rate, average event size, hot query window, and legal or business retention. The hot tier serves current operations, investigation, and alarm review with predictable writes and bounded reads. A warm tier stores compressed details or continuous aggregates. A cold tier provides economical retention rather than interactive latency. Different data classes need different policies: security audit, alarm state, high-frequency waveform, and five-minute aggregate do not share the same value curve.
Timescale hypertables partition time-series data into chunks so queries can exclude irrelevant ranges. Smaller chunks are not automatically better. Oversized active chunks and indexes may not fit memory, while undersized chunks increase object count and planning overhead. Official guidance relates the interval to active data and memory, but a production interval still depends on measured ingest rate, indexes, out-of-order window, and query shape. Retention should drop whole chunks rather than run large row-by-row DELETE operations. Downsampled aggregates must be proven sufficient for business queries before raw data is removed.
A practical event record often contains tenant_id, device_id, metric_key, event_time, ingested_at, a typed value, unit, quality, schema_version, source_event_id, trace_id, and lineage state. Unique constraints must remain compatible with partition columns. More importantly, do not require every historical field to become NOT NULL immediately. Constraint changes can scan or rewrite a large time-series table. Use expand, observe, repair or backfill, enforce, and contract phases, with statement timeout, lock-wait budget, and reversal criteria for each phase.
6. A Real Timescale Migration Incident Shows the Blast Radius
An anonymized production failure captured by existing regression tests occurred while adding a lineage field to a compressed telemetry hypertable. The migration first created a nullable column and then ran UPDATE ... WHERE lineage_status IS NULL. That apparently ordinary backfill matched the full historical table and attempted to decompress approximately 3,138,971 tuples against an environment limit of 100,000. Schema bootstrap rolled back. Because the column did not exist, the next request attempted the entire bootstrap again.
The direct cause was a blanket historical update on compressed chunks. The root cause crossed two architecture boundaries. First, migration was placed in the telemetry repository's construction path, making live requests responsible for database evolution. Second, initialization cached only success and had no failed state or backoff, so each write request retried the expensive operation. Repeated bootstrap attempts saturated the synchronous API thread pool. The process still accepted TCP connections, but could no longer return responses promptly. One storage migration had become an API outage.
The correct fix was not to raise the tuple decompression limit. The new field used a metadata-safe ADD COLUMN ... NOT NULL DEFAULT rather than row-by-row backfill. Existing nullable fields that could not be tightened safely retained defaults instead of rewriting hot history. Each check constraint ran in an isolated, timeout-bounded transaction so one failure did not prevent other schema preparation. Repository initialization entered an observable cooldown after failure rather than retrying per request. The focused Timescale tests assert that no blanket UPDATE is generated, timeouts precede constraint validation, a failed constraint does not abort subsequent items, and 25 consecutive calls do not amplify one bootstrap failure.
The reusable lesson is that a telemetry-history migration is an online systems change with traffic, compression state, lock competition, and a failure budget—not routine ORM startup work. A migration that must scan history should run as a separate chunk-bounded job while monitoring locks, WAL, decompression, replication lag, and ingest latency. If it cannot finish within the budget, retain a compatible read path instead of forcing a constraint into one deployment window.
7. Observability Must Explain Where Data Is Stuck
CPU, memory, and database connection counts cannot operate a telemetry pipeline. Each layer should expose input, accepted, rejected, backlogged, processing duration, and output counts, linked by trace_id or stable event identity. Field and edge metrics include acquisition success, spool depth, oldest backlog age, and disk watermark. Admission metrics include identity failure, schema rejection, duplicate, collision, and quarantine rate. Messaging needs partition lag, utilization, retry, and replay speed. Storage needs write latency, chunk creation, compression and retention jobs, lock wait, and failed batches. Projections and applications need freshness age, quality distribution, state update delay, and bounded-query timeout.
Closed-loop invariants are more useful than isolated alerts. For example, accepted = persisted_history + quarantined_after_accept + pending_within_budget exposes unexplained loss. latest_state_event_time <= max_accepted_event_time detects projections that move beyond accepted evidence. A continuously increasing queue_oldest_age under a stable input rate shows that processing capacity has fallen below arrival rate. Metric names can vary, but every accepted event needs an explainable destination.
Before production rollout, rehearse at least six failures: upstream network loss, a healthy broker with stopped consumers, database write rejection, duplicate delivery, conflicting content under one ID, and unknown schema or invalid time window. Recovery validation must go beyond green service health. Confirm that backlog declines, duplicates do not create additional historical facts, quarantined items can be repaired and replayed, late events do not overwrite latest state, and replay does not reopen alarms incorrectly. Without those proofs, “automatic retry” merely postpones the incident until the data volume is larger.
8. Minimum Rollout Sequence and Boundaries
First, freeze the event and failure contract: identity, event ID, event time, ingest time, schema version, quality, unit, trace, and acceptance result. Second, establish bounded edge spooling, platform queues, deduplication, and quarantine before adding sophisticated streaming computation. Third, separate historical facts, latest state, alarms, and aggregates, and bound every query by tenant, time, and point count. Fourth, add compression, retention, hot/cold tiers, and online schema evolution, with failure drills attached to every material change.
This sequence does not require a large data stack for every project. A private deployment with dozens of devices, low-frequency sampling, and acceptable manual recovery can use a single broker, PostgreSQL or TimescaleDB, and in-process projections as long as contracts, idempotency, quarantine, retention, and recovery boundaries remain explicit. Conversely, continuous waveforms, video, and millisecond control loops do not belong on a conventional telemetry path. Waveforms need specialized high-throughput acquisition and object storage, video needs a media pipeline, and hard real-time control stays in the PLC, controller, or edge loop rather than relying on average cloud-queue latency.
If a platform currently combines device registration, full telemetry, latest state, alarms, and search in one service, use Core Architecture of an IoT Device Management Platform to establish ownership before splitting processes. The smallest effective change is to give each layer a separate success result, failure reason, and recovery action. Components can be replaced later; missing contracts make every upgrade amplify the old coupling.
Conclusion
The quality of an industrial telemetry pipeline is not measured by how many products appear in its architecture diagram. It is measured by whether every event can answer six questions: where was it observed, how was it normalized, why was it accepted or quarantined, was immutable history persisted, how was current state calculated, and did the application see the result within its freshness budget?
Separating field evidence, edge buffering, platform admission, message backlog, historical storage, state projections, and application queries does not eliminate duplicates, reordering, weak networks, schema upgrades, or database maintenance. It confines those failures to boundaries that can be explained, replayed, and rolled back. For industrial IoT systems, that property is more valuable than the shortest possible data-flow arrow.
References and Evidence Boundaries
- OASIS MQTT Version 5.0
- AsyncAPI Specification 3.0.0
- OpenTelemetry Collector internal telemetry
- Timescale hypertables
- Timescale data retention policy
- First-hand validation comes from existing ZedIoT architecture material, ZedIoT Core telemetry-ingest and Timescale regression artifacts, and this run's focused result of
29 passed in 0.91s. These sources support the invariants and failure shape described here; they do not constitute a universal throughput, latency, capacity, or SLO guarantee for another deployment.