

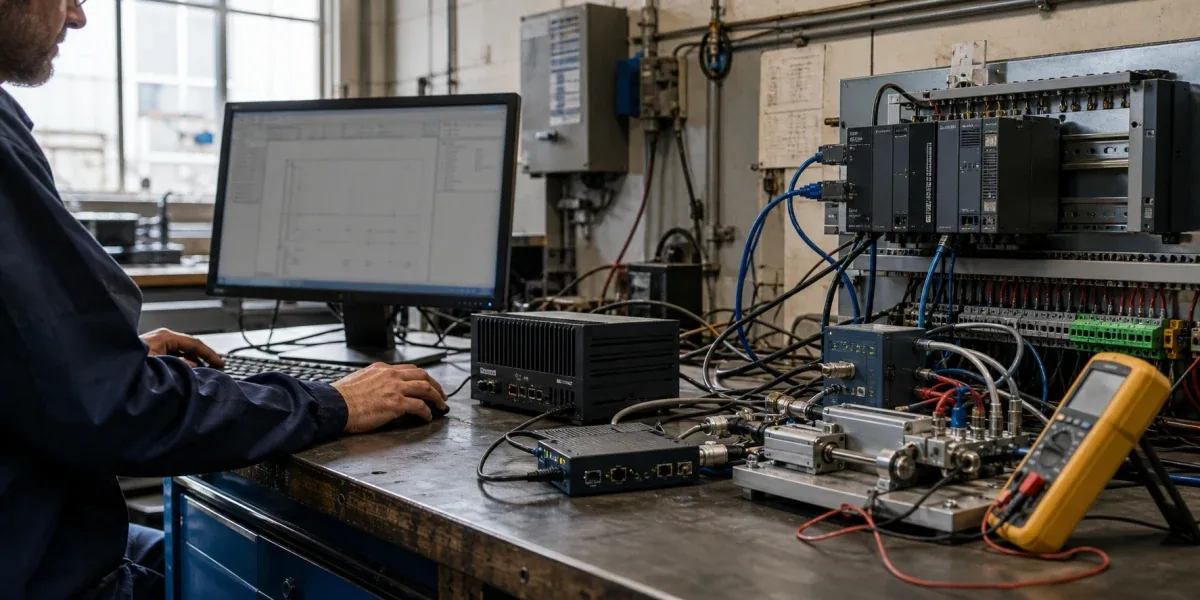
The most underestimated part of an upper-computer project is not drawing the interface or opening a serial port. It is the transition from “an engineer can exchange data on a development laptop” to “the customer can accept the system on site, diagnose a failure, and recover from a bad release.” The first result proves that a communication path exists. The second is a deliverable industrial application.
The central conclusion is that upper-computer software is not a protocol client with charts; it is a runtime boundary that connects device facts, operator intent, and delivery evidence. It must define at least five things: how protocol data becomes an identified value, how the application determines whether state is fresh and trustworthy, how a control command reaches a terminal outcome, how diagnostic evidence is retained, and how software and configuration are upgraded or rolled back. Without one of those boundaries, a polished screen can still leave an operator unable to distinguish a stopped device from a stale display, or a successful command from a request that merely left the UI.
This article uses ZedIoT material as first-hand evidence for the scope of parsing, mapping, and multi-protocol integration. It also uses command-lifecycle, field-level state-semantics, and gateway-command tests from the ZedIoT Core codebase. We reran tests/test_telemetry_state_semantics.py and tests/test_gateway_command_transport.py; all 45 tests passed. These artifacts establish specific implementation invariants. They do not establish production throughput, long-term availability, safety certification, or one mandatory stack for every upper-computer project.
1. Decide whether custom upper-computer software is justified
The need for local collection, control, and visualization does not automatically justify a new desktop application. A register viewer or protocol tool is often sufficient for single-device commissioning and short-lived test fixtures. A mature HMI or SCADA product is usually more economical when the project fits standard PLC drivers, screens, alarms, and audit requirements. Custom software becomes valuable when device semantics, workflows, permissions, offline operation, specialist algorithms, or the delivery form cannot be expressed reliably by those tools.
Three questions provide a useful admission test:
- Can an existing tool express the device's operational state and workflow, rather than only read and write addresses?
- Does the project require dedicated authorization, algorithms, reports, traceability, or an offline data loop?
- Will the lifecycle frequency of change repay the permanent cost of testing, packaging, upgrading, and field support?
If the answer to all three is no, configuring a supported HMI or SCADA system is probably safer than creating a new codebase. Custom development offers precise control over the business boundary, but the team then owns protocol compatibility, fault recovery, installation, and maintenance for the lifetime of the system.
2. Start with one acceptable vertical slice, not a feature inventory
Requirements often begin with login, device lists, real-time charts, parameter screens, and reports. Those features can be developed in parallel without forming a dependable system. A stronger starting point is one vertical slice using a real device and a representative point: connection, decoding, quality evaluation, display, command, acknowledgement, logging, and fault diagnosis. That slice becomes the reference implementation for every later device and screen.
For a temperature controller, the slice might read the process temperature over Modbus TCP, transform it using a versioned mapping, display the value with observation time and quality, and submit a new setpoint through range and authorization checks. The command receives a unique ID, reaches the device, waits for a protocol acknowledgement or state readback, and finishes as acknowledged, failed, timed out, or uncertain. An acceptance engineer can export the command ID, raw request, device response, timestamps, and application build that produced the result.

The value of the slice is not the number of completed pages. Real data crossing every boundary reveals whether the register list omits byte order, type, scale, or unit; whether the device provides a meaningful acknowledgement; whether an offline state is confused with a last-known value; and whether the logs can reconstruct a field incident.
3. Separate protocol facts from operational semantics
Serial transport, TCP, Modbus RTU/TCP, CAN, and OPC UA define transport or protocol expression. They do not decide what a value means to the application. An upper-computer project needs an explicit adapter contract that records connection parameters, addressing, frame boundaries, data type, byte order, scaling, unit, direction, polling interval, timeout, retry policy, and mapping version.
A reviewable point definition can look like this:
point_id: freezer-07.temperature.current
source: modbus-tcp://192.168.10.20:502/unit/1/holding/40021
source_type: int16
byte_order: big
scale: 0.1
unit: Cel
poll_interval_ms: 1000
timeout_ms: 800
access: read_only
mapping_version: 2.3.1
Raw frames or register values must not disappear. During diagnosis, the team needs to answer what the driver received, which mapping produced the current value, and where decoding failed. At the same time, raw data must not bypass the mapping layer and enter charts or reports. Otherwise, a firmware address change or a new scale factor looks like a real process event.
A Modbus address or OPC UA NodeId is a source reference, not a business identity. The Modbus Application Protocol defines function codes and a data model, while the project still owns register allocation, type, unit, and meaning. OPC UA provides an information model, security, and services, but it does not replace site-specific asset and operating rules. A dependable adapter emits a standardized event with source evidence; a separate semantic mapping decides whether the event may advance runtime state.
4. HMI values need time and quality, not only a number
The most dangerous illusion in a real-time chart is that a last value remains visible and therefore appears current. A deliverable application should distinguish observed_at, when the device or collector observed a value, from ingested_at, when the application received it, and evaluate freshness against the current time. Fields with different update frequencies need field-level timestamps rather than one message timestamp that refreshes every value.
The ZedIoT Core state-semantics tests exercise this distinction. After sparse messages are merged, a newly updated temperature remains fresh while an older lock state becomes independently stale. Unmapped values enter diagnostic items rather than masquerading as trusted operational state. The same boundary applies to an upper computer: the state layer should retain value, unit, source, mapping version, observation time, freshness, and quality. The HMI then derives color, interaction, and alarms from the state contract instead of inventing its own interpretation.
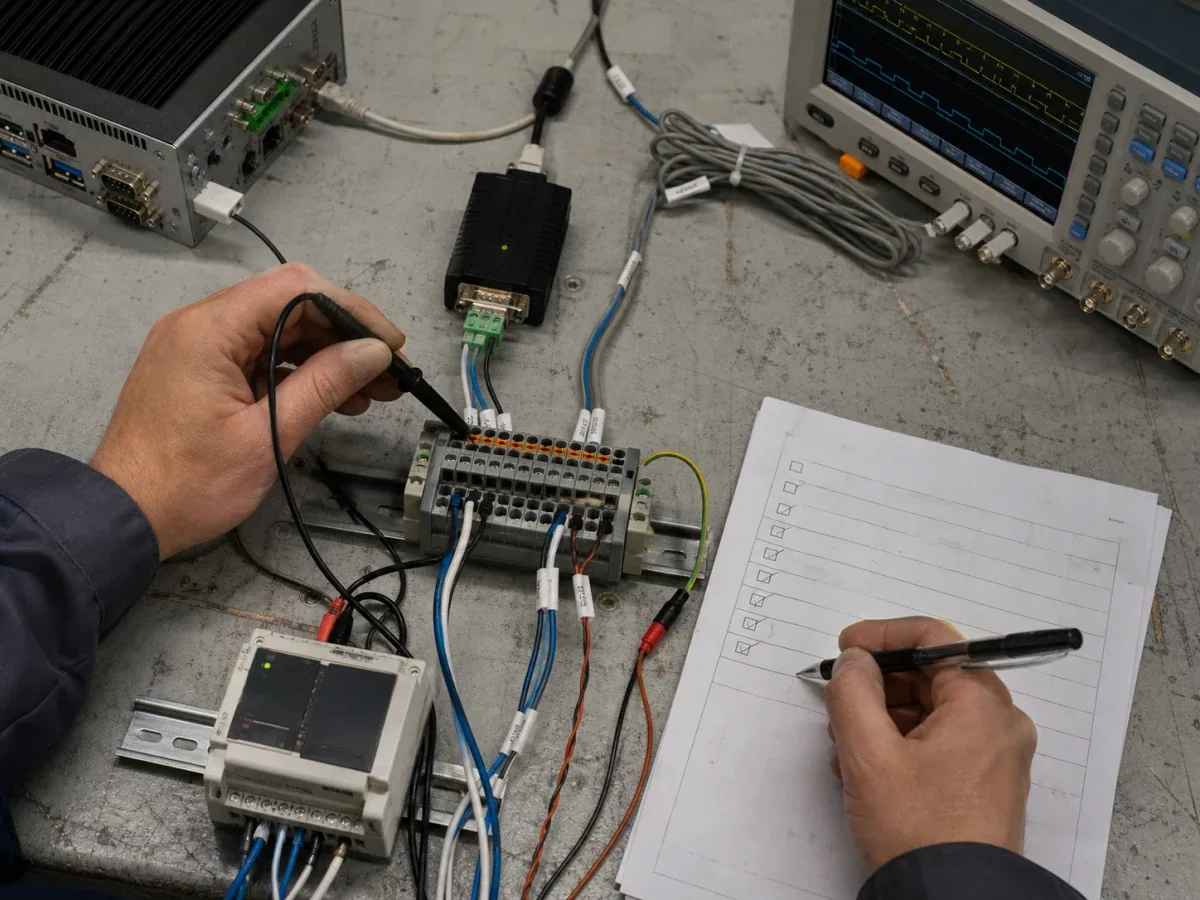
Visualization must follow those semantics. A chart may freeze during disconnection to preserve context, but it must show a gap or stale marker. Missing data must not become zero. An out-of-range sample can be retained for diagnosis without driving automatic control. The software has defined “current value” only when the screen, log, export, and alarm use the same quality rules.
5. A control button must connect to a command state machine
A “sent successfully” toast usually proves only that a request left the UI. The command may not have reached the device, or the device may have executed it while the acknowledgement was lost. A controllable system needs a unique command_id and idempotency key, and distinct states such as created, sent, acked, failed, timeout, cancelled, and uncertain_effect.
The ZedIoT Core panel command lifecycle creates an idempotency key for each operation and polls within a bounded timeout window. It treats uncertain_effect as terminal, preventing the interface from presenting an unknown result as perpetually in progress. Gateway command transport tests cover signed transport, replay, and receipt paths. The transferable judgment is crucial: a timeout does not prove that the device did nothing, and automatic retry is not safe by default. A start operation, motor movement, or parameter write may not be naturally idempotent. When the result is uncertain, the application should require state readback or operator reconciliation instead of immediately sending the action again.
Before submission, the application should enforce permissions, ranges, modes, and interlocks. After submission it should retain the operator, workstation, device, parameters, mapping version, application build, timestamps, and terminal result. Safety-relevant write access should be separate from ordinary monitoring access. If the project cannot state which commands may be retried, its control design is incomplete.
6. Observability must support one field replay
Having log files is not the same as being diagnosable. A field incident crosses connection, protocol, mapping, state, interface, and device boundaries. Uncorrelated text lines cannot reconstruct that path. A connection session, sample, or command should carry a trace_id, while structured events capture endpoint, device ID, protocol operation, mapping version, duration, result code, and a safe form of raw evidence.
A minimum diagnostic bundle should contain:
- application, configuration, device-model, and firmware versions;
- connection changes, timeouts, and reconnect counts;
- parse failures and unmapped points with reason codes;
- command requests, receipts, terminal results, and associated state readbacks;
- a bounded window of relevant frames or register snapshots;
- system time, time zone, and observed clock offset.
The bundle must not automatically include passwords, tokens, personal data, or complete production recipes. The observability boundary is enough evidence to reproduce with minimum disclosure. Field allowlists, redaction, retention, and export permissions belong in the design, not in an improvised response after an incident.
7. Treat application, configuration, and rollback as one release surface
Upper-computer applications often run on long-lived industrial PCs with restricted permissions, weak connectivity, and short maintenance windows. Running on a developer machine does not prove installability on the target. A successful install does not prove that the new version can read old configuration and history. The delivery contract should lock operating system, architecture, runtime, drivers, display scaling, installation privileges, and startup behavior. Database and configuration changes need explicit schema versions.
A dependable package includes the application build, supported configuration-schema range, migration steps, checksums, release notes, and a rollback point. The sequence is backup, compatibility preflight, migration, startup, and a read-only smoke test with a simulator or device. On failure, both binary and configuration must be restored. If a migration is irreversible, “install the old executable” is not a rollback plan.
Offline sites add signing, removable-media handling, and time synchronization. Remote auto-update fits sites with mature network and operations controls. Regulated or highly available sites may need staged releases, parallel version directories, and a supervised window. The goal is not maximum release frequency. It is a known impact and a tested recovery path for every change.
8. Make the acceptance matrix the definition of done
Screenshots cannot prove protocol, state, or control semantics. An acceptance matrix should combine scenario, input, expected state, evidence, and recovery action:
| Scenario | Expected behavior | Acceptance evidence |
|---|---|---|
| Normal collection | Type, scale, unit, time, and quality are correct | Raw value, mapping version, and HMI value reconcile |
| Disconnect and recovery | State moves from fresh to stale/unavailable; recovery does not invent continuity | Connection events, chart gap, and recovery time |
| Partial or malformed frame | Trusted state is not advanced; a reason code is retained | Diagnostic event and quarantined sample |
| Successful write | Permission and range checks pass; terminal result is traceable | command_id, receipt, and state readback |
| Lost acknowledgement | Result is timeout or uncertain, with no blind resend | Command trace and reconciliation record |
| Failed upgrade | Activation stops and the verified build is restored | Backup, migration log, and rollback smoke result |
This matrix requires a real device, a protocol simulator, or replayable samples in the acceptance environment. Failure scenarios deserve the same priority as the happy path. Accepting only normal screens defers the most expensive defects to the production site.
9. Delivery boundaries determine maintainability
Before handover, define who owns the address register, who approves changes to points and units, who controls installation certificates and signing keys, how remote support is authorized, how long logs are retained, and who runs regression tests after PLC, firmware, or operating-system changes. The upper-computer team cannot accept unlimited responsibility for an unstable third-party protocol, site network, or device behavior. The customer should not be locked into a black box that cannot export configuration, evidence, and version information.
Use a mature protocol tool for temporary register access. Prefer an established HMI or SCADA package for standard plant monitoring. Build custom upper-computer software when the system needs dedicated device semantics, complex workflows, offline algorithms, an independent deliverable, or controlled command behavior. ZedIoT's industrial IoT engineering services can start with protocol and device commissioning, prove one acceptable vertical slice, and then decide which capabilities should be custom and which should reuse supported platforms.
A finished upper computer is not one where every button can be clicked. It is one where normal operation, failure, and upgrade paths all have verifiable outcomes. Protocol mapping makes values interpretable. State semantics stop stale values from impersonating live state. A command state machine prevents “sent” from becoming “successful.” Observability supports field replay, and versioned rollback makes change controlled. Together, these boundaries turn a commissioning demo into acceptable and maintainable industrial software.