

Suppose an edge board is advertised at “18 tokens/s.” That number does not tell you how long a person will wait for an answer. The run might have used a short prompt, one request, and an exposed development board. Your product may retrieve a long equipment manual, refresh a display, and run inside a fanless enclosure. Those are different workloads, so their speed numbers are not directly comparable.
An acceptance test should separate the wait for the first content token from the pace of subsequent tokens, then examine memory, temperature, failures, and whole-system power under sustained load. Freeze the model, quantization, input and output lengths, concurrency, and environment before comparing devices. Without those conditions, a single tokens/s figure is not a purchasing result or a product-experience result.
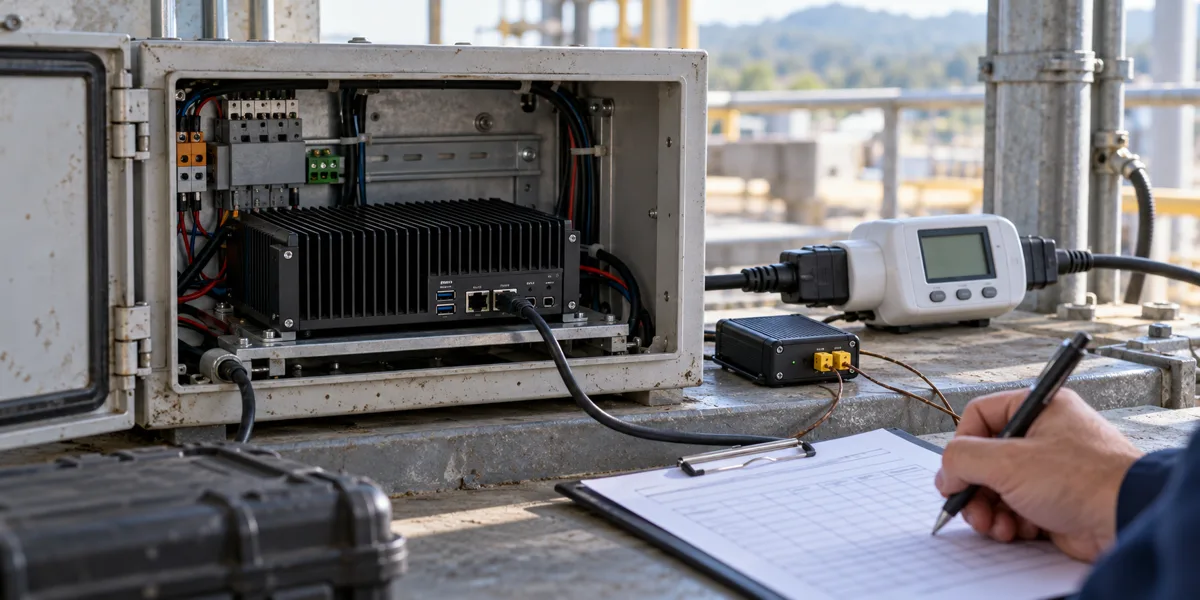
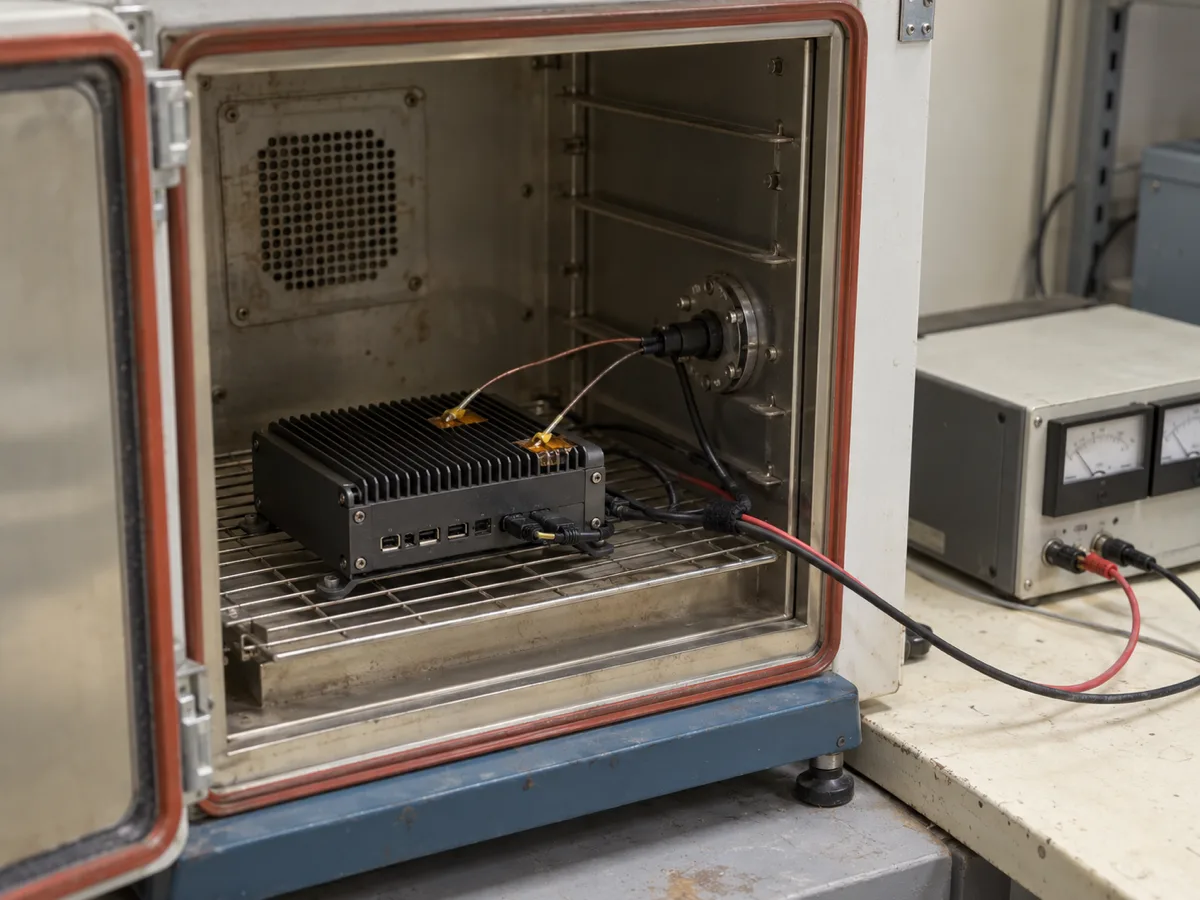
The cover and environmental-test image below illustrate a test setup; neither is a measurement or test record from this article.
Separate the wait from the stream
First-token latency has a measurement boundary
After someone submits a query, the application may queue the request, retrieve material, assemble the prompt, tokenize it, process the input, and only then produce a first token. In this article, client TTFT is the interval from the client sending the request to the client receiving its first non-empty content token. If the product has a display, record the time when the first character has actually rendered as a separate first-visible metric. Receiving a token and showing it are not the same event.
A timestamp inside the model covers only part of this path. It does not by itself include retrieval, queuing, transport, or rendering. Label every TTFT with the location of its start and end timestamps. Otherwise one team may report model prefill time while another reports the user's wait, and both spreadsheets will use the same column name.
TPOT, or time per output token, describes the intervals after the first token. A long response can have an acceptable first-token time yet stall repeatedly; a fast decoding engine can still leave the user waiting at the start. Keep TTFT, subsequent-token pace, and complete-request latency separate. Preserve individual requests, not just their average. MLCommons' discussion of small-LLM inference likewise separates prompt processing from later token generation.
This timeline separates client TTFT, input processing, later token arrivals, and first-visible text. It shows observable events, not a claim that model execution and display rendering cannot overlap or that this article measured a device.

What matters depends on the job
For a short device-status answer, first-token wait and the rate of failed short requests may dominate. For an assistant that walks a technician through a repair, later-token pacing and the quality of a long answer matter as well. Record the actual task, intended output length, and acceptable wait before choosing thresholds. A TTFT target copied from another product cannot account for your retrieval step, interface, or input length.
If two configurations have similar decoding throughput, the one that reloads the model for every request can still feel much slower. Conversely, a prompt-cache hit may make a benchmark look excellent while ordinary uncached requests perform poorly. Test both situations and identify which one the product will actually encounter.
Freeze a workload that another engineer can repeat
Record the exact model artifact and hash, quantization format, runtime build, accelerator backend, operating-system image, driver, power mode, and enclosure. A model-family label such as “7B” is not enough. Context length, KV-cache format, offload split, batching, and sampling configuration can all change the memory and timing result. If any of these change, start a new run ID rather than blending its samples into the old average.
Use the same versioned prompt set on every candidate. Include the product's ordinary short interaction, a longer troubleshooting question, and an input near its permitted upper range. “Short” and “long” should be defined by your own request distribution, not a universal 512- or 4096-token rule. Store actual input and output token counts; a response that stops after ten tokens should not be compared with a 300-token answer using total latency alone.
| Control | Record it as | Error if omitted |
|---|---|---|
| Model and software | Artifact hash, quantization, runtime/backend versions | A software or quality change looks like a hardware win |
| Request shape | Prompt-set version, input/output tokens, context limit, cache state | A short-prompt result is applied to long-document use |
| Load | Sessions, target concurrency, display or acquisition tasks | Resource contention disappears from the test |
| Environment | Supply, enclosure, ambient temperature, cooling, power mode | An open board stands in for the packaged device |
The smallest useful test matrix has several distinct jobs. Run every group repeatedly with the same model and prompt-set version; count successful and failed requests together. Substitute a real background task for the example display task if the product has no display. Do not invent a workload simply to fill a row.
| Group | Start and request | Parallel condition | Question it answers |
|---|---|---|---|
| A: first use | Cold start, short input, one session | Normal resident services | Is loading part of the first user's wait? |
| B: common use | Warm model, short input, one session | Same as A | What are normal TTFT and TPOT distributions? |
| C: upper input | Warm model, business-length long input | Same as A | Do prefill and memory degrade with context? |
| D: shared device | Mixed short/long prompts at target concurrency | Real display, capture, or network work | Does queuing or tail latency rise? |
| E: sustained use | Repeat B–D inside the target enclosure | Target power and ambient conditions | Does the result drift after thermal stabilization? |
This is a protocol to fill in, not a claim that five rows automatically qualify a device. The team must set actual lengths, repetitions, duration, and pass criteria before the run. Lowering the target after observing failures would turn an acceptance test into a demonstration.
Begin with the system at a documented idle state. Confirm that a background download or build is not consuming resources. Run a short request first to verify that client and server events can be correlated; then increase input length and concurrency. Retain the prompt length and system events for failed requests. Finally restart the model process so the cold-start path is not accidentally mixed with warm requests. If a result looks unusual, reproduce it under the original conditions before changing one variable at a time.
Choose the tool for the layer being measured
llama-bench can isolate engine behavior
The official llama.cpp llama-bench distinguishes prompt processing, text generation, and a combined run. It supports repeated measurements and machine-readable output. This makes it useful for checking whether a change affects input processing or decoding on the same device. Its documentation also says that its timings exclude tokenization and sampling. Calling its prompt-processing time “user TTFT,” or its generation throughput “application throughput,” would claim more than the tool measures. Keep the command, output, executable build, model hash, system state, and per-run results. See the llama-bench README.
Do not crown a winner when a configuration's apparent advantage is smaller than the variation between repeated runs. Check frequency, background activity, and thermal state, then repeat. Engine tests help locate a slow phase; they do not tell you whether a document retriever, transport path, or user interface is responsible for the visible delay.
The server and the real client answer different questions
If the product exposes llama-server, measure the same prompt set at the server layer. Its official speed-bench is primarily designed for speculative-decoding comparisons. It can also save configuration, completed and failed samples, request latency, and server prompt/predicted-token rates as JSON. That is useful evidence about the server setup, but it is not a universal edge-device benchmark or a substitute for the application client. Read the SPEED-Bench documentation.
At the outside edge, instrument the real client with timestamps from one monotonic clock: request sent, first non-empty content token received, and last content token received. Record the first rendered character separately if there is a UI. Keep errors and cancellations. An entirely local UI should be measured along its local path; adding an HTTP server only to fit a benchmark would change the system under test. Engine, server, and client numbers are complementary diagnostic views, not interchangeable values that can be placed in one unlabeled TTFT column.
Look at memory and energy on the whole product
The model file is not the peak memory footprint. Weights sit alongside a KV cache, runtime workspace, operating system, other resident services, and possibly additional sessions. Record process RSS, system-available memory, swap or OOM events, and the memory used by actual display or capture work. With memory-mapped or shared pages, one process's RSS is not the exclusive whole-device cost; use a consistent collection method and cross-check against system memory and failures.
A short run proves that a configuration can start, not that it can serve all day. Design a sustained period around the real product duty cycle. The topic plan suggests observing for at least 30 minutes, but this article has not performed that run; 30 minutes is neither a measured result nor a universal pass threshold. In the target enclosure, supply, ambient temperature, and concurrent workload, record frequency, temperature, TTFT, TPOT, memory, and failures throughout. A board that performs well for five minutes but slows as it heats up should not be sold on its cold-run tokens/s number.
State where power was measured. Chip TDP, an adapter's rated wattage, and measured whole-system wall power are different quantities. A battery product needs its own power-chain boundary and sampling rate; a comparison between devices needs the same workload and measurement point. MLCommons Edge distinguishes measured system power from rated figures and says its power measurement applies to the accompanying benchmark workload. The same discipline prevents an internal report from pairing idle watts with full-load tokens/s.
Keep an acceptance record, not a highlight number
Save raw request-level events and a grouped summary. Each group needs total requests, successes, timeouts, errors, cancellations, TTFT and later-token distributions, complete latency, peak memory, and the thermal state at the beginning and end. A percentile without a sample count is hard to interpret; a p95 computed from a handful of requests is not a stable service claim. Keep the outliers so another engineer can determine whether a long wait came from a queue, a cold model load, or faulty instrumentation.
The following blank record is a starting point. request_sent_ms, first_content_ms, and last_content_ms must use one client monotonic clock. Client TTFT is the second minus the first; complete latency is the third minus the first. If TPOT is reported as the mean interval between content tokens, divide the time from first to last content token by the number of subsequent token intervals. With fewer than two tokens, report it as unavailable, not zero. If transport coalesces several tokens into one event, client event spacing is not model per-token timing; name the reported metric accordingly.
The sustained run also needs a time-series file linked by run_id. Each row should carry a sample time, whole-system watts, temperature, and frequency. Define the measurement point, sampling interval, and steady-state rule before the run; do not select the most favorable window afterward. If an external power meter and the client do not share a monotonic clock, capture synchronization markers and the offset before aligning requests with power and thermal samples. The template combines run-level metadata with request-level fields; start and end temperatures do not replace the raw series.
run_id: # links to model hash, quantization, runtime, enclosure, power, prompts
test_start_utc:
telemetry_path: # rows: elapsed_ms, system_power_w, temperature_c, frequency_mhz
telemetry_sample_interval_ms:
telemetry_clock_alignment: # sync markers/offset to the client monotonic clock
system_power_source: # wall / battery / board counter, with actual measurement point
steady_window_start_elapsed_ms: # define rule and window before the run
steady_window_end_elapsed_ms:
steady_window_rule:
request_id:
group: # A/B/C/D/E
input_tokens:
output_tokens:
request_sent_ms:
first_content_ms:
first_visible_ms: # blank without a rendered UI
last_content_ms:
status: # success / timeout / error / cancelled
error_code:
peak_process_rss_bytes:
system_available_min_bytes:
temperature_start_c:
temperature_end_c:
raw_log_path:
The failure-rate denominator is every request actually sent. Track user-initiated cancellation separately from system failure instead of silently dropping it. Report sample counts and distributions by A–E group; never average cold and warm starts together. If you change quantization, evaluate answer quality with the same business prompts as well. A faster model that drops safety-critical repair steps is not a better product simply because it fits the memory budget.
Pass criteria come from the product task. How long may a technician wait at the machine? How many failed requests are acceptable while image capture also runs? Who signs off on enclosure temperature and whole-system power? Agree on these before seeing the device's results. When only engine throughput has been measured, report “engine measured; product experience unverified,” not “device accepted.”
Failure patterns suggest the next investigation, not an automatic diagnosis. High TTFT with steady later tokens points toward cold loading, retrieval, queuing, long prompts, or prefill. Fast first token followed by slowing output calls for checks of memory contention, growing context, and thermal throttling. Problems confined to concurrent requests call for examination of queueing, session caches, and batching. An OOM event calls for a weights/KV-cache/resident-service inventory before changing quantization, context, or hardware. Re-run the original request set after each single-variable change.
When these results should not drive a purchase
Without the target device, enclosure, and chosen model, this protocol prepares an acceptance test; it cannot rank boards. An exposed development board's cold result does not predict sustained thermals inside a sealed case. If model or quantization is still in flux, establish runtime support and answer quality first. Equal tokens/s from two configurations may accompany unequal answer quality.
For a retrieval-assisted device, keep a pure-model run and a complete RAG-path run. The first isolates inference; the second includes document search, authorization filtering, and prompt assembly. Do not use pure-model TTFT as a promise about the user's full workflow. Weak networking, camera concurrency, battery aging, or other site-specific factors need separate delivery validation; a laboratory baseline is not field evidence.
If you have only public specifications today, use the edge LLM hardware selection sequence to shortlist devices, then fill this protocol for each candidate. If model format or backend is unsettled, consult the edge LLM runtime comparison. A device-specific conclusion requires raw records from the chosen model under the product's load. This article supplies a method, not measured rankings for any device.