

InfluxDB Development Services for IoT Data and Operational Analytics
Build an InfluxDB data layer that can ingest field telemetry reliably, control storage growth, answer operational questions quickly, and support dashboards, alerts, reports, and analytics.
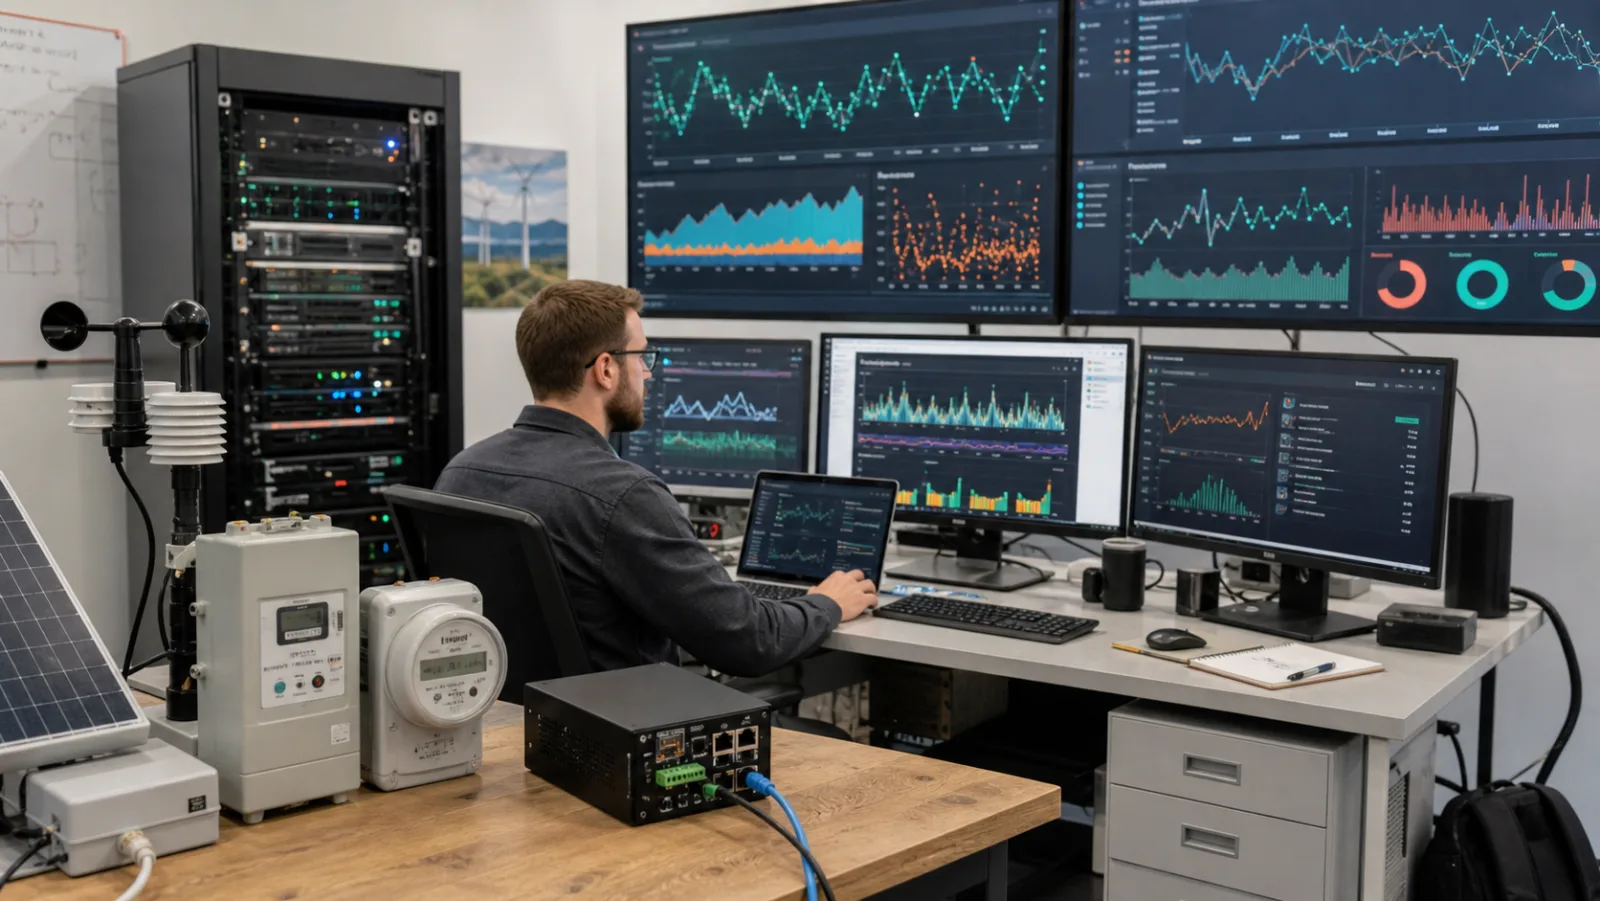
Time-series problems usually begin before the database slows down
Uncontrolled tags, inconsistent timestamps, indefinite raw retention, dashboard-first schema choices, and missing workload evidence create latency, storage cost, and operational risk later.
Query latency grows with the wrong shape
The problem may be cardinality, time range, grouping, refresh rate, joins, task design, or a dashboard asking for more data than users need.
Poor data management hides meaning
Units, quality, device metadata, time precision, tenant ownership, and version changes must be handled consistently from ingestion onward.
Storage cost follows retention decisions
Raw telemetry, diagnostics, trends, reports, compliance history, and exports do not all need the same precision or lifetime.
Design ingestion, resolution, and retention around operational decisions
Useful time-series architecture preserves the evidence needed for immediate action, later diagnosis, reporting, and long-term analysis without keeping every raw point forever.
InfluxDB services from first schema to production operations
We can improve an existing workload or build a new time-series foundation connected to the wider IoT platform and business systems.
Time-series database implementation
Design buckets, measurements, tags, fields, timestamps, tenancy, retention, access, backup, and deployment around the real query workload.
High-performance data ingestion
Build ingestion from MQTT, gateways, platform services, collectors, APIs, files, and industrial data pipelines with buffering and back-pressure.
Real-time analytics and alerts
Create queries, aggregations, downsampling, anomaly or threshold inputs, dashboards, reports, and alert-ready datasets.
IoT platform integration
Connect device registry, permissions, assets, metadata, telemetry, events, dashboards, business APIs, and long-term analytics.
Optimize for the questions people will ask repeatedly
The schema should support the operating team, service engineers, customer views, reports, analytics jobs, and future integration without turning every query into a full-data scan.
Series cardinality
Keep high-cardinality identifiers and metadata out of uncontrolled tags; model around the filters and groupings users actually need.
Retention and downsampling
Match raw, hourly, daily, and compliance data lifetimes to diagnostic, operational, reporting, and cost requirements.
Ingestion reliability
Plan batching, precision, retries, deduplication, buffering, queue limits, and back-pressure from the field to storage.
Tenant and data access
Separate sites, customers, products, service teams, and analytics jobs with explicit tokens, permissions, and audit boundaries.
Query and dashboard workload
Optimize for the time windows, grouping, joins, rollups, and refresh rates that operators and reports need.
Operations and recovery
Monitor writes, queries, storage growth, compaction, memory, disk, tasks, backups, restore, and capacity thresholds.
Place time-series storage where data ownership and operations make sense
The right topology depends on field connectivity, latency, data residency, customer isolation, maintenance capacity, and expected growth.
Managed cloud deployment
Use managed operations when speed, elastic capacity, and reduced database administration outweigh private-infrastructure requirements.
Private or on-premises deployment
Keep time-series data in a customer-controlled environment with defined backup, capacity, security, and maintenance ownership.
Edge plus central storage
Retain short-term field data locally, forward selected history centrally, and survive unreliable links without losing operational context.
Turn telemetry history into visibility, diagnosis, and action
Time-series storage creates value when it shortens investigation, improves operating decisions, and feeds the systems people already use.
Equipment health and OEE
Store machine state, cycle time, counters, alarms, quality, vibration, temperature, and maintenance signals.
Energy and environmental monitoring
Analyze temperature, humidity, pressure, power, flow, emissions, weather, and site performance over time.
Distributed asset fleets
Compare sites, customers, device models, firmware versions, connectivity, failures, and usage patterns across a fleet.
Operational analytics
Support live dashboards, reports, alert evaluation, troubleshooting, trend review, and downstream AI or data pipelines.
Start with a workload review, not a generic database benchmark
Share sample telemetry, device count, write rate, dashboard queries, retention needs, current storage growth, deployment constraints, and known slow operations.
InfluxDB development questions
Clarify schema, cardinality, retention, deployment, migration, dashboards, and operational ownership before changing the data layer.
What does an InfluxDB development project include?
A project may include workload review, schema and cardinality design, ingestion pipelines, retention and downsampling, queries, dashboards, alert datasets, tenant access, migration, deployment, monitoring, backup, restore, capacity planning, and IoT platform integration.
How do you control InfluxDB storage growth?
We separate raw operational data from longer-term trends and reports, then define retention, downsampling, aggregation tasks, export or archive needs, precision, and capacity thresholds around the actual business use.
Why does time-series cardinality matter?
High-cardinality tags can create a very large number of series, increasing memory, storage, and query cost. Device and tenant identifiers, metadata, dynamic values, and query filters must be modeled deliberately.
Can InfluxDB be deployed privately or on premises?
Yes. We can support private, on-premises, cloud, or edge-central patterns. The design should define security, data residency, backup, restore, monitoring, capacity, upgrades, and the team responsible for operations.
Can ZedIoT integrate InfluxDB with MQTT and IoT platforms?
Yes. We can connect MQTT brokers, gateways, collectors, platform services, device metadata, dashboards, alerting, APIs, reports, and downstream analytics while keeping the data contracts and ownership clear.
How do you approach an existing slow InfluxDB workload?
We begin with write rate, series cardinality, bucket size, retention, task workload, query profiles, dashboard refresh, memory and disk metrics, deployment topology, and sample slow queries before changing the schema or infrastructure.
Review your IoT time-series workload
Share your data sources, sample points, expected write rate, device and tenant count, dashboard queries, retention goals, deployment preference, and current performance issue. We will help define the next practical step.
- AI + IoT product architecture review
- Hardware, firmware, cloud, and application integration
- Prototype planning and production support