

AI and IoT Insights
Practical articles on IoT platforms, edge gateways, embedded software, AI workflows, industrial protocols, smart hardware, and connected-product decisions.
When to Use Dify Instead of Custom AI App Development
Dify can accelerate Workflow, RAG, Agent, and API-based AI applications, but it should not replace a complex business backend. Use this decision guide to define system...
Read articleStart from the project question, then go deeper
Use categories when you are comparing protocols, planning an IoT platform, choosing edge hardware, or deciding how AI should connect with device workflows.
Browse by engineering topic
This category could cover topics such as development tools, platforms, and hardware for building IoT solutions, including guides on using tools like Arduino, Raspberry...
View category- When to Use Dify Instead of Custom AI App Development
- Why LwM2M Is Becoming a Deployment Gate in 2026
- ESPHome vs OpenMQTTGateway for Home Assistant Bridge Devices
This section could focus on key IoT communication protocols such as MQTT, Matter Protocol, and their updates, especially for applications in smart homes and other IoT ...
View category- Why LwM2M Is Becoming a Deployment Gate in 2026
- ESPHome vs OpenMQTTGateway for Home Assistant Bridge Devices
- OpenThread and ESP32-C6 in Practice: When Thread Mesh Beats More Wi-Fi
Articles related to the integration of machine learning and computer vision in IoT projects could go here. This would include tutorials on frameworks like OpenMV, Open...
View category- When to Use Dify Instead of Custom AI App Development
- When to Use LlamaIndex for RAG Knowledge Bases
- How to Build Practical AI Agents with OpenAI APIs
A category dedicated to topics like edge computing, AI analytics, and how data processing is handled on IoT devices and platforms. This would also include the benefits...
View category- Historian vs Time-Series Database for Industrial IoT
- MQTT Sparkplug B vs Custom Topics in Industrial IoT
- Why Local Architecture Matters More Than Device Count in Home Assistant Energy Management
This could focus on industry-specific IoT implementations, such as smart factories, logistics automation, medical IoT solutions, and device management for large-scale ...
View category- AI Vision Workstation vs Handheld Scanner: How to Choose for Warehouse Recognition
- AI Warehouse Recognition Workstation Use Cases
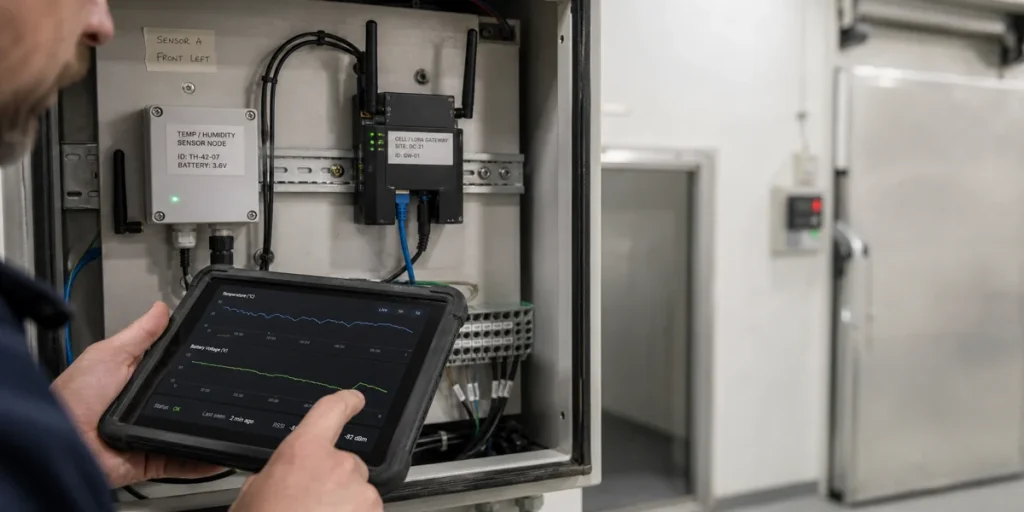
- Why Freezer Controllers Need Remote Monitoring and Alerts
Learn Embedded System Development with practical insights, essential tips, and best practices for creating innovative, high-performance projects.
View category- Wukong AI, T5AI-Core, or Standard TuyaOS: Which Path Fits Better?
- Tuning ESPHome Voice Satellites for Low Latency and Stability
- Wi-Fi Serial Converter vs ZigBee Serial Converter: How to Choose
Technical articles about AIoT SaaS Platform for AI, IoT, embedded, platform, gateway, and connected-device projects.
View category- Remote Diagnostics for Low-Power IoT Devices
- Device Jobs vs Remote Commands vs Real-Time Control
- When to Use ZedIoT for Private IoT Platform Deployment
Guides, tutorials, and case studies on Tuya IoT, Cloud API, and SDK integration to help you build scalable, production-ready smart devices and custom solutions.
View category- Wukong AI, T5AI-Core, or Standard TuyaOS: Which Path Fits Better?
- How Tuya Smart MiniApps Work with AI Agents for Device Control
- Tuya OEM to SDK App Migration Without User Disruption
Technical articles about Retail IoT for AI, IoT, embedded, platform, gateway, and connected-device projects.
View category- AI Inventory Management and Auditing: Smarter Retail Starts with Automation and Real-Time Visibility
- Employee Behavior Monitoring: How Smart Retail Improves Service and Operations
- AI Foot Traffic Analysis: Smart Retail Layout Optimization and Marketing Insights
Recently published articles
Why LwM2M Is Becoming a Deployment Gate in 2026
LwM2M in 2026 is more than lightweight device management. Using OMA 1.2.2, SVE-44, and Germany’s smart-meter rollout as signals, this guide defines qualification tests...
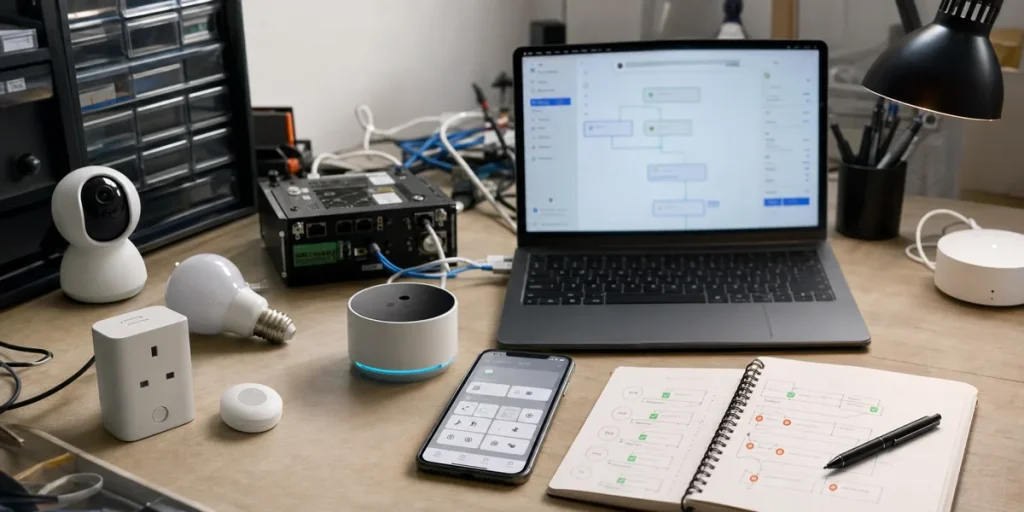
ESPHome vs OpenMQTTGateway for Home Assistant Bridge Devices
Use ESPHome when known sensors, actuators, and Modbus registers should become native Home Assistant entities. Use OpenMQTTGateway when BLE, RF, IR, and serial traffic ...

When to Use LlamaIndex for RAG Knowledge Bases
LlamaIndex fits RAG systems that need multi-source ingestion, repeatable indexing, tunable retrieval, and evaluation. Small, stable, or fully managed knowledge bases o...
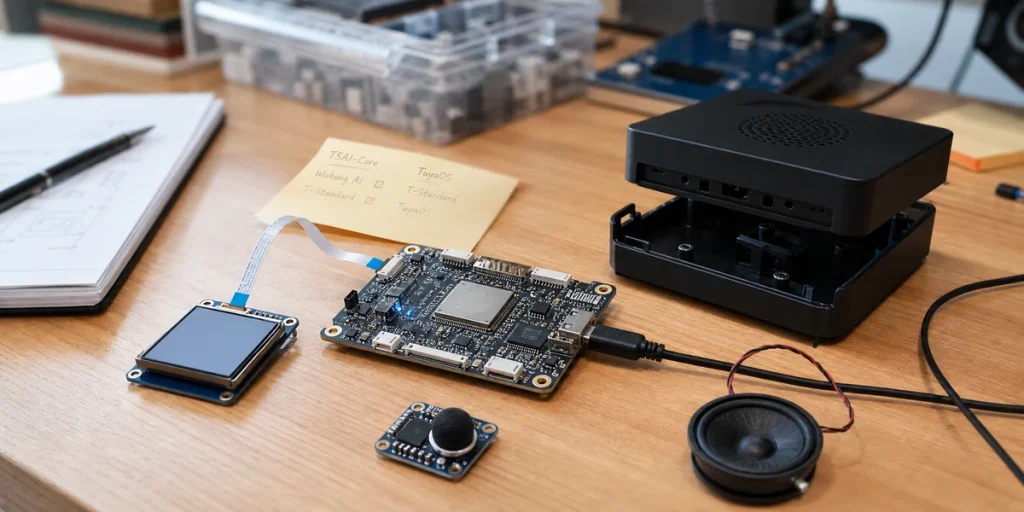
Wukong AI, T5AI-Core, or Standard TuyaOS: Which Path Fits Better?
Tuya AI hardware selection should not start with the newest AI label. Wukong AI fits AI-first hardware, T5AI-Core and T5AI-Board fit voice and display validation, and ...
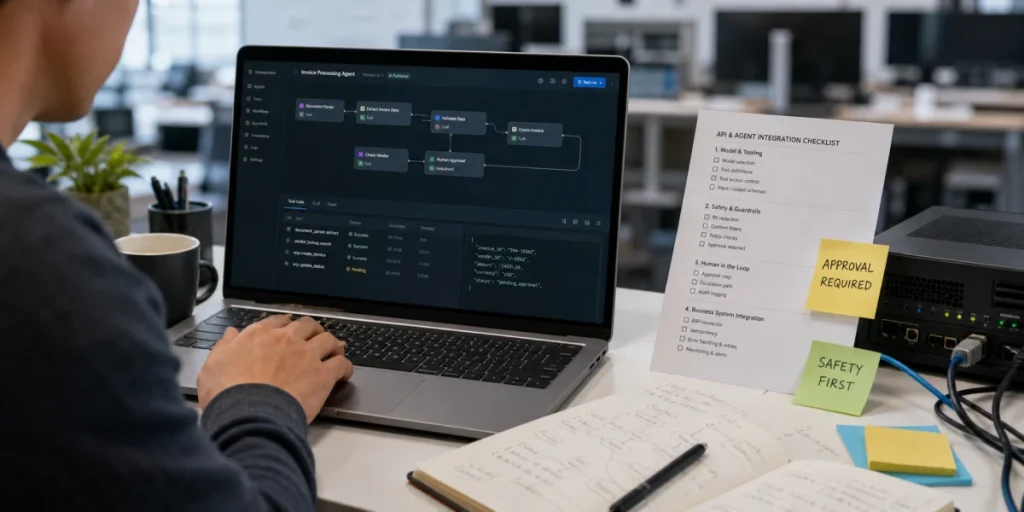
How to Build Practical AI Agents with OpenAI APIs
Practical OpenAI agent development is not just a chatbot demo. It requires clear tool definitions, authorization, structured outputs, human approval, logging, retries,...
How Tuya Smart MiniApps Work with AI Agents for Device Control
Tuya Smart MiniApps can provide a lightweight AI interaction entry point, but they should not replace device-control governance, audit, or business orchestration. This...
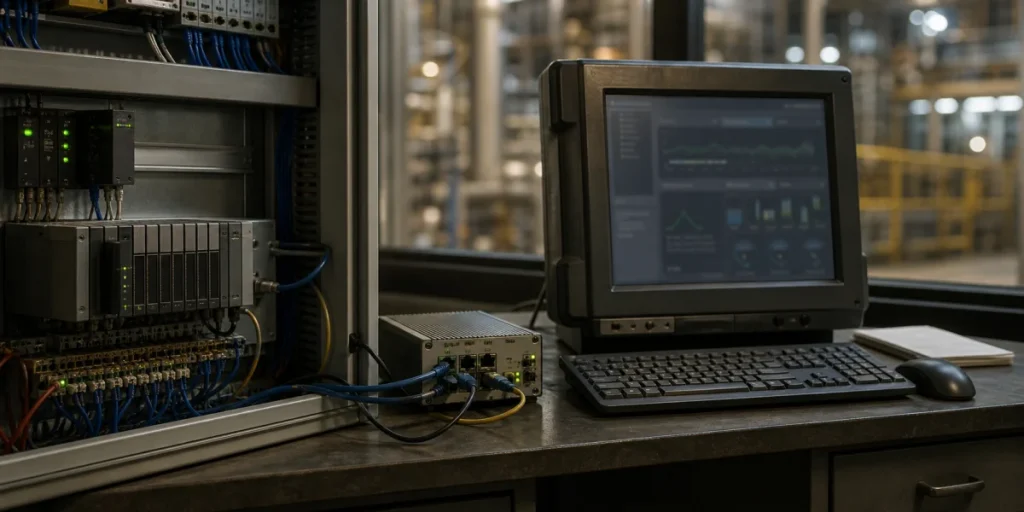
Historian vs Time-Series Database for Industrial IoT
Plant historians and general time-series databases are not simple replacements for one another. This guide compares them by data quality, compression, tag governance, ...
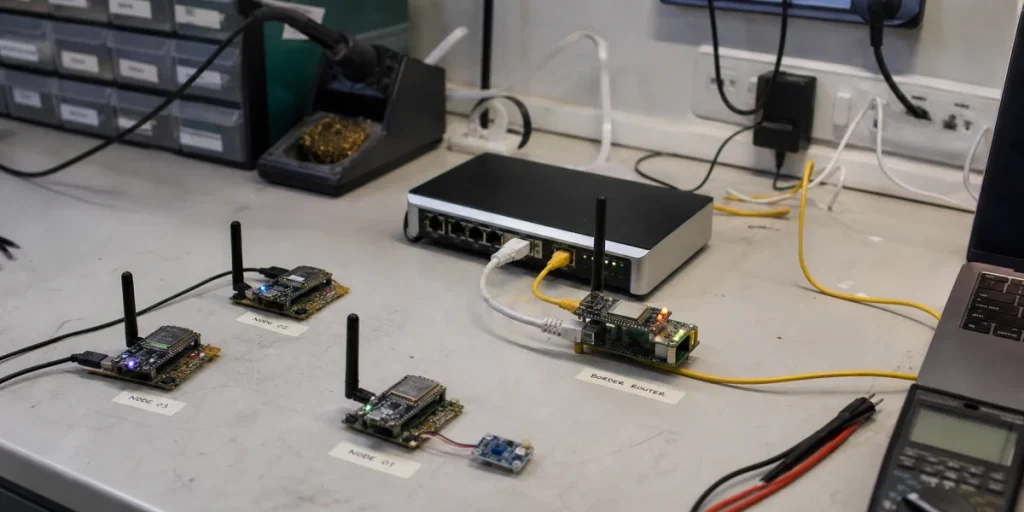
OpenThread and ESP32-C6 in Practice: When Thread Mesh Beats More Wi-Fi
Learn how OpenThread, Thread Mesh, Matter, ESP32-C6/H2, and Thread Border Routers fit together, and when Thread is the right choice for low-power multi-node IoT devices.
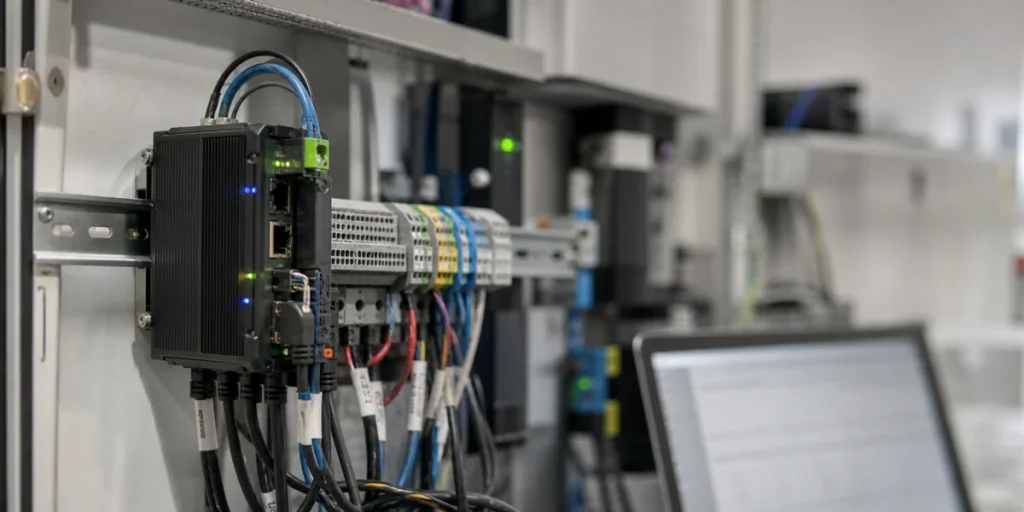
Remote Diagnostics for Low-Power IoT Devices
A deep implementation guide to low-power IoT remote diagnostics: event contracts, queue backpressure, idempotent retries, job state machines, tiered retention, and fau...
Tuya OEM to SDK App Migration Without User Disruption
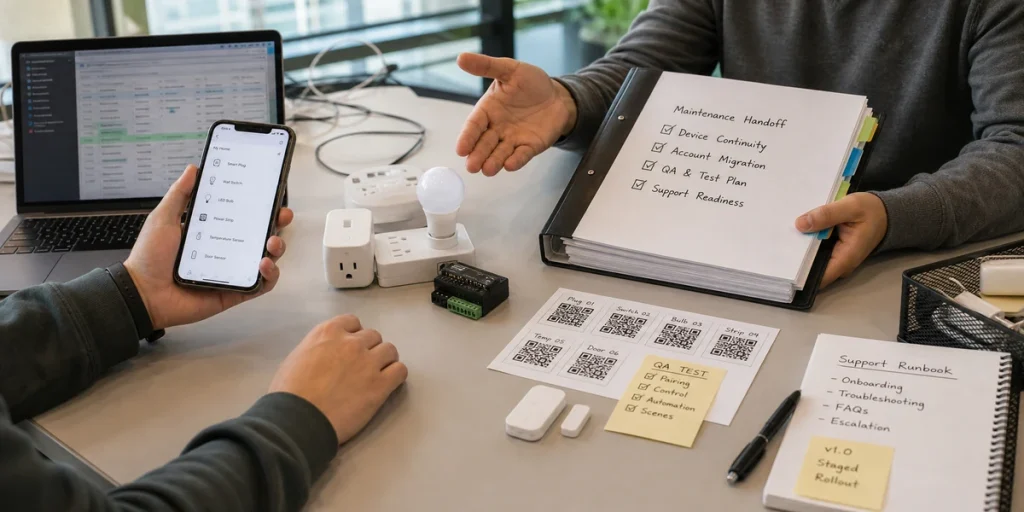
A Tuya OEM to SDK app migration is not only an SDK integration task. The hard parts are account mapping, device continuity, panel compatibility, staged rollout, rollba...
MQTT Sparkplug B vs Custom Topics in Industrial IoT
Sparkplug B fits industrial MQTT systems that need device discovery, lifecycle state, and consistent metric semantics. Custom MQTT topics fit lightweight telemetry, bu...
Continue with the path that matches your current decision
Use the blog for technical context, then move into a focused guide, delivery service, product foundation, or related project case.
Need to apply one of these ideas to your device or platform?
Share your device type, protocol, site conditions, platform goals, or AI workflow. We can help you evaluate the most practical implementation path.